


The LED fixtures inside a school trophy case look identical when the lights are on: same color temperature label, same brightness level, same supplier. What facilities teams and athletic directors often cannot see — but what a smartphone camera shooting at 240 fps, a video crew panning across the display, and any visitor with a photosensitive condition will notice immediately — is the cyclic output variation that most LED drivers produce when they convert alternating current into the direct current LEDs require. Flicker completing 100 or 120 cycles per second is invisible to casual inspection but measurable, documentable, and correctable with a structured audit.
A school trophy case LED flicker-index test provides the objective measurement that distinguishes safe, camera-stable lighting from fixtures that will produce rolling bands in photographs, generate headache complaints from staff who work near the display, or create visible strobing during school video productions. This guide walks facilities teams, athletic directors, and recognition-program owners through the full process: what the metric means, how to measure it, what the numbers require, and how to use the results.
LED flicker is not a hypothetical concern in school recognition spaces. Trophy case corridors see heavy camera traffic during athletic banquets, senior night ceremonies, championship announcement events, and yearbook photography sessions. Any of these can reveal driver-induced flicker that no visual walkthrough detects — and that produces footage requiring correction, complaints from photographers, and a display that looks less professional than the awards it holds.

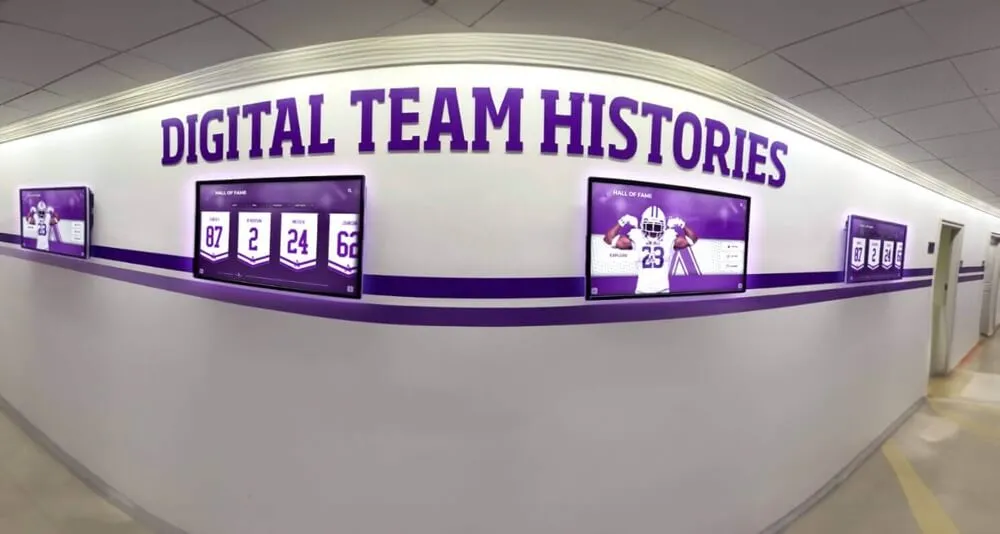
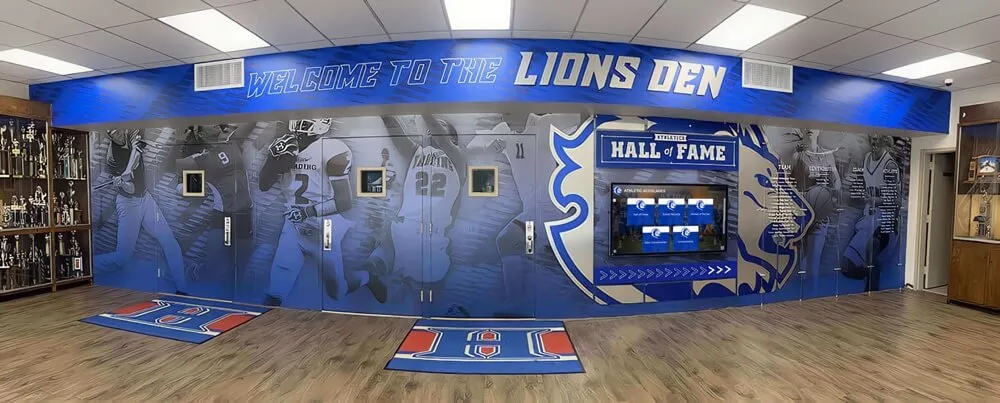
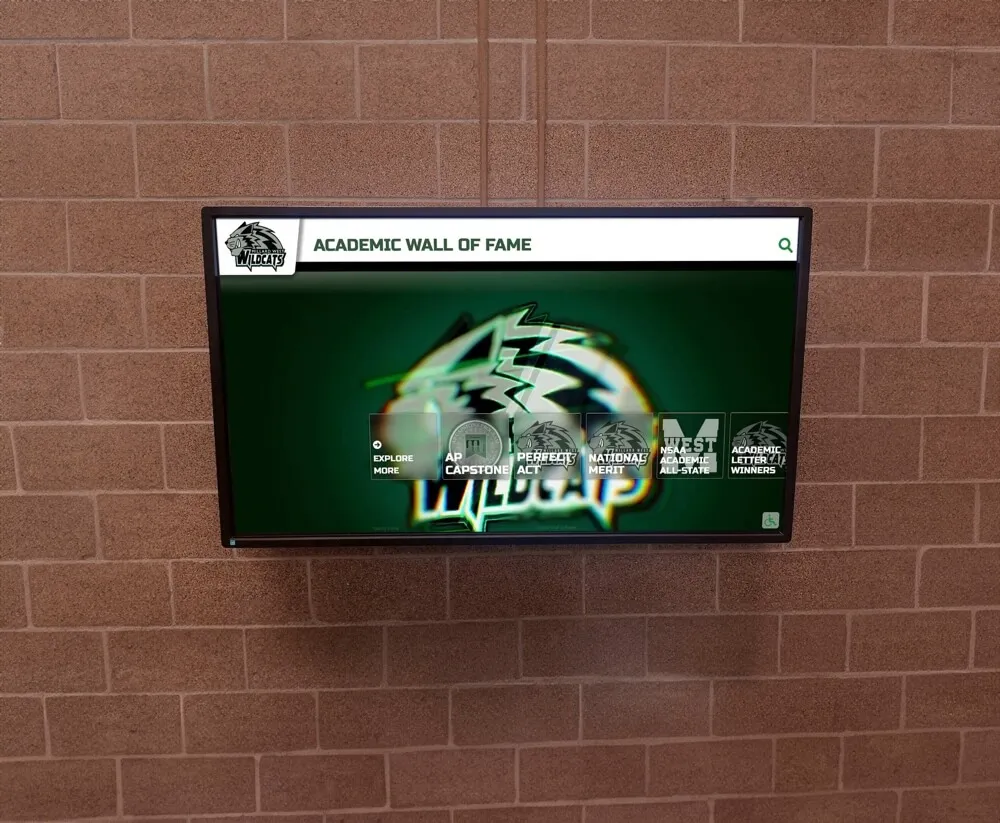
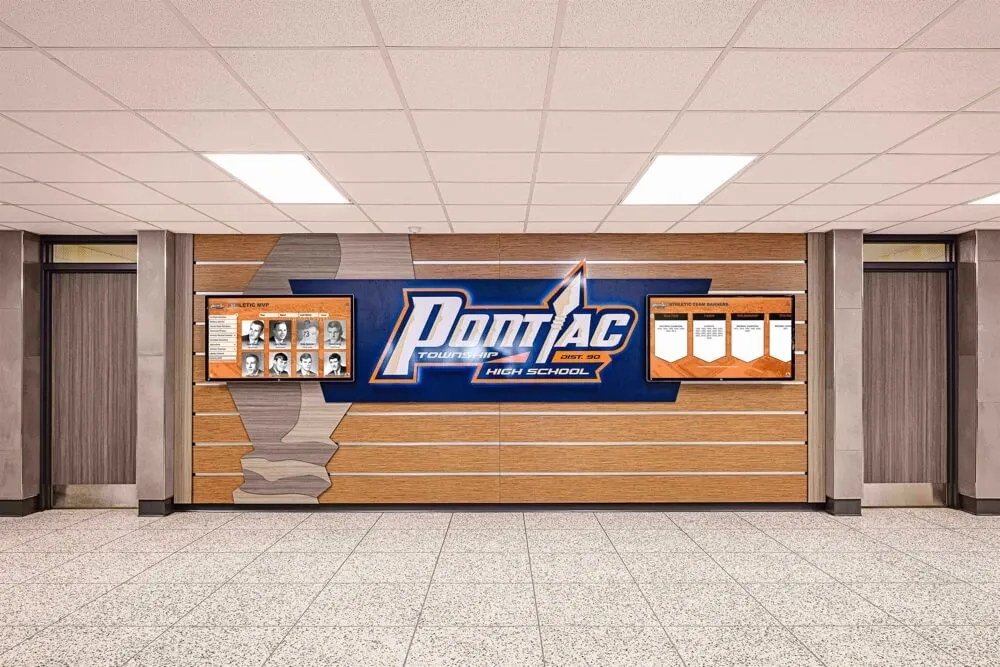
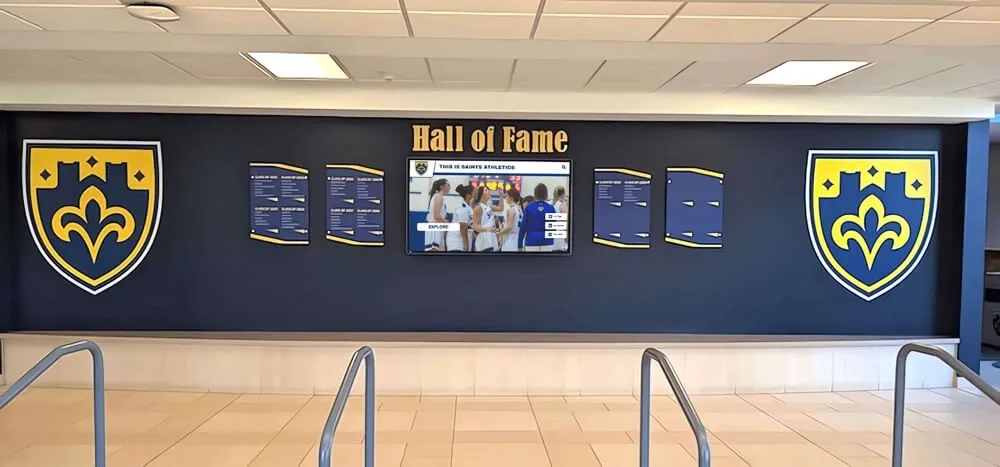
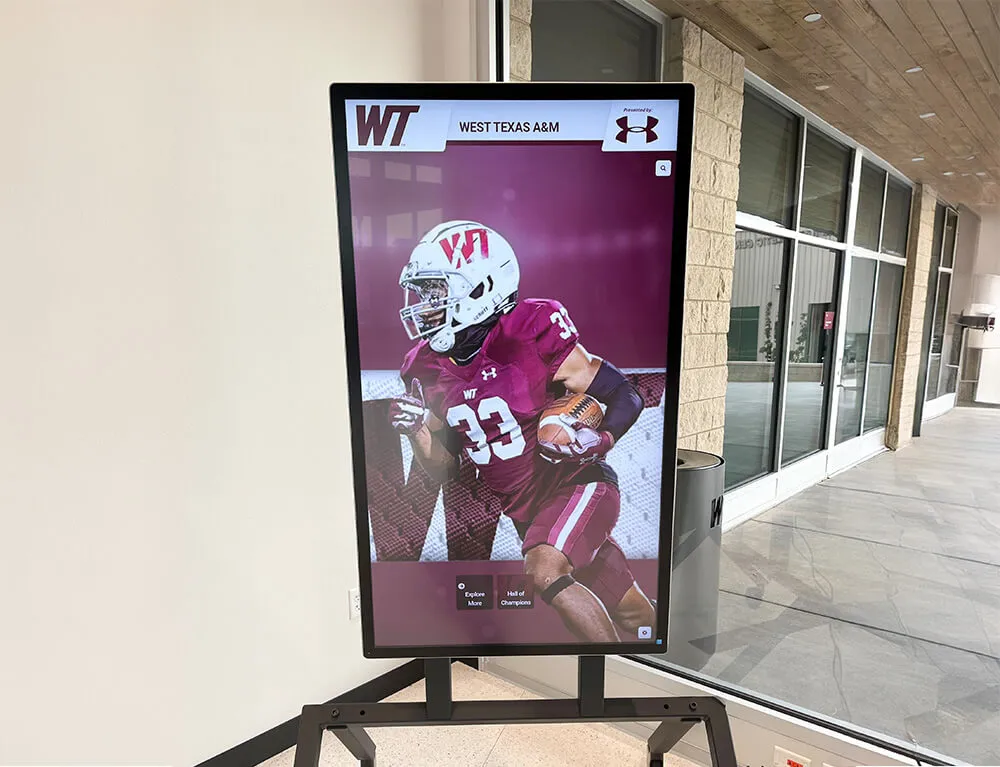
Recognition displays combining physical award cases with digital screens require consistent, flicker-free LED lighting across both elements to present a unified, professional appearance to every visitor and camera
What Is Flicker Index?
Flicker Index is an IES-defined metric that quantifies the cyclic variation in a light source’s output over a single waveform cycle. Unlike the simpler Percent Flicker measurement — which only captures how far output swings between its maximum and minimum values — Flicker Index accounts for the shape of the entire output waveform, giving it higher diagnostic value when comparing drivers with different ripple profiles.
How Flicker Index is calculated:
Flicker Index = Area of the waveform above the mean light output ÷ Total area under the complete waveform cycle
The result is a dimensionless number between 0.0 and 1.0:
- 0.0: Perfectly steady output — no variation at any point in the cycle
- 0.5: A common result for fluorescent fixtures at full ripple — the light is above mean for exactly half the cycle
- 1.0: Light is fully on for exactly half the cycle and completely off for the other half — maximum possible flicker
How Percent Flicker is calculated:
Percent Flicker = (Maximum output − Minimum output) ÷ (Maximum output + Minimum output) × 100
A fixture with Percent Flicker of 0% delivers perfectly steady light. A fixture fully switching between on and off produces 100% Percent Flicker. IES and IEEE PAR 1789-2015 guidance specifies maximum acceptable values for each frequency band, because flicker at lower frequencies (50–120 Hz) causes more perceptible effects than flicker completing thousands of cycles per second.
Why Flicker Index Is More Diagnostic Than Percent Flicker
Two drivers can produce identical Percent Flicker values while delivering very different waveform shapes. Flicker Index captures that shape difference. A driver with a sharp, narrow spike in its output cycle scores very differently from a driver with a smooth sine-like variation — even when both measure the same peak-to-trough swing. For trophy case auditing, recording both metrics provides a complete picture.
The IEEE PAR 1789 Connection
IEEE PAR 1789-2015 establishes risk zones for LED flicker based on frequency and modulation depth. At 100–120 Hz — the range where most LED driver ripple falls — the standard identifies Percent Flicker above 8% as a potential risk zone for prolonged exposure. Flicker Index targets below 0.04 align with the low-risk operating range for display-area lighting where visitors spend extended time.
Why LED Flicker Matters in School Trophy Cases
Standard fluorescent fixtures have long been associated with 100–120 Hz flicker, and the shift to LED was intended to improve that. Low-cost LED drivers with inadequate ripple filtering can produce flicker at the same rates — and sometimes worse — without any visible sign at normal observation distances. Trophy case environments amplify three specific consequences that make flicker index measurement worth scheduling.
Camera incompatibility and banding: Digital cameras sample light at a fixed frame rate. When the camera’s sampling interval and the fixture’s flicker cycle interact unfavorably, the sensor captures different points in the flicker waveform at different image rows, producing horizontal banding across the photograph. This appears in still images as subtle light-dark striping and in video as rolling bands that move through the frame. At 120 Hz driver ripple, cameras shooting at 24 or 30 fps are particularly vulnerable. Trophy cases photographed during athletic banquets, press events, or school video productions expose this problem publicly.
Visitor discomfort under extended exposure: Visitors who spend time at interactive trophy case displays — parents reviewing season award recipients, alumni navigating historical recognition archives, students reading display content during passing periods — accumulate flicker exposure that may contribute to eye strain and headache. Individuals with photosensitive conditions, including migraine disorders, are more sensitive to sub-threshold flicker than the general population. A trophy case positioned near a frequently occupied commons area warrants a stricter flicker index target than one in a low-traffic corridor.
Video production cost and post-production correction: Schools recording athletic highlight videos, recognition ceremony footage, or hallway tours that include the trophy display area find that high-flicker fixtures require post-production correction. Color grading tools can reduce visible banding but cannot fully recover footage with severe flicker. The cost appears in editing time rather than in the lighting budget, which makes it easy to overlook until productions are consistently coming back from the camera operator with apologies about the trophy case corridor.
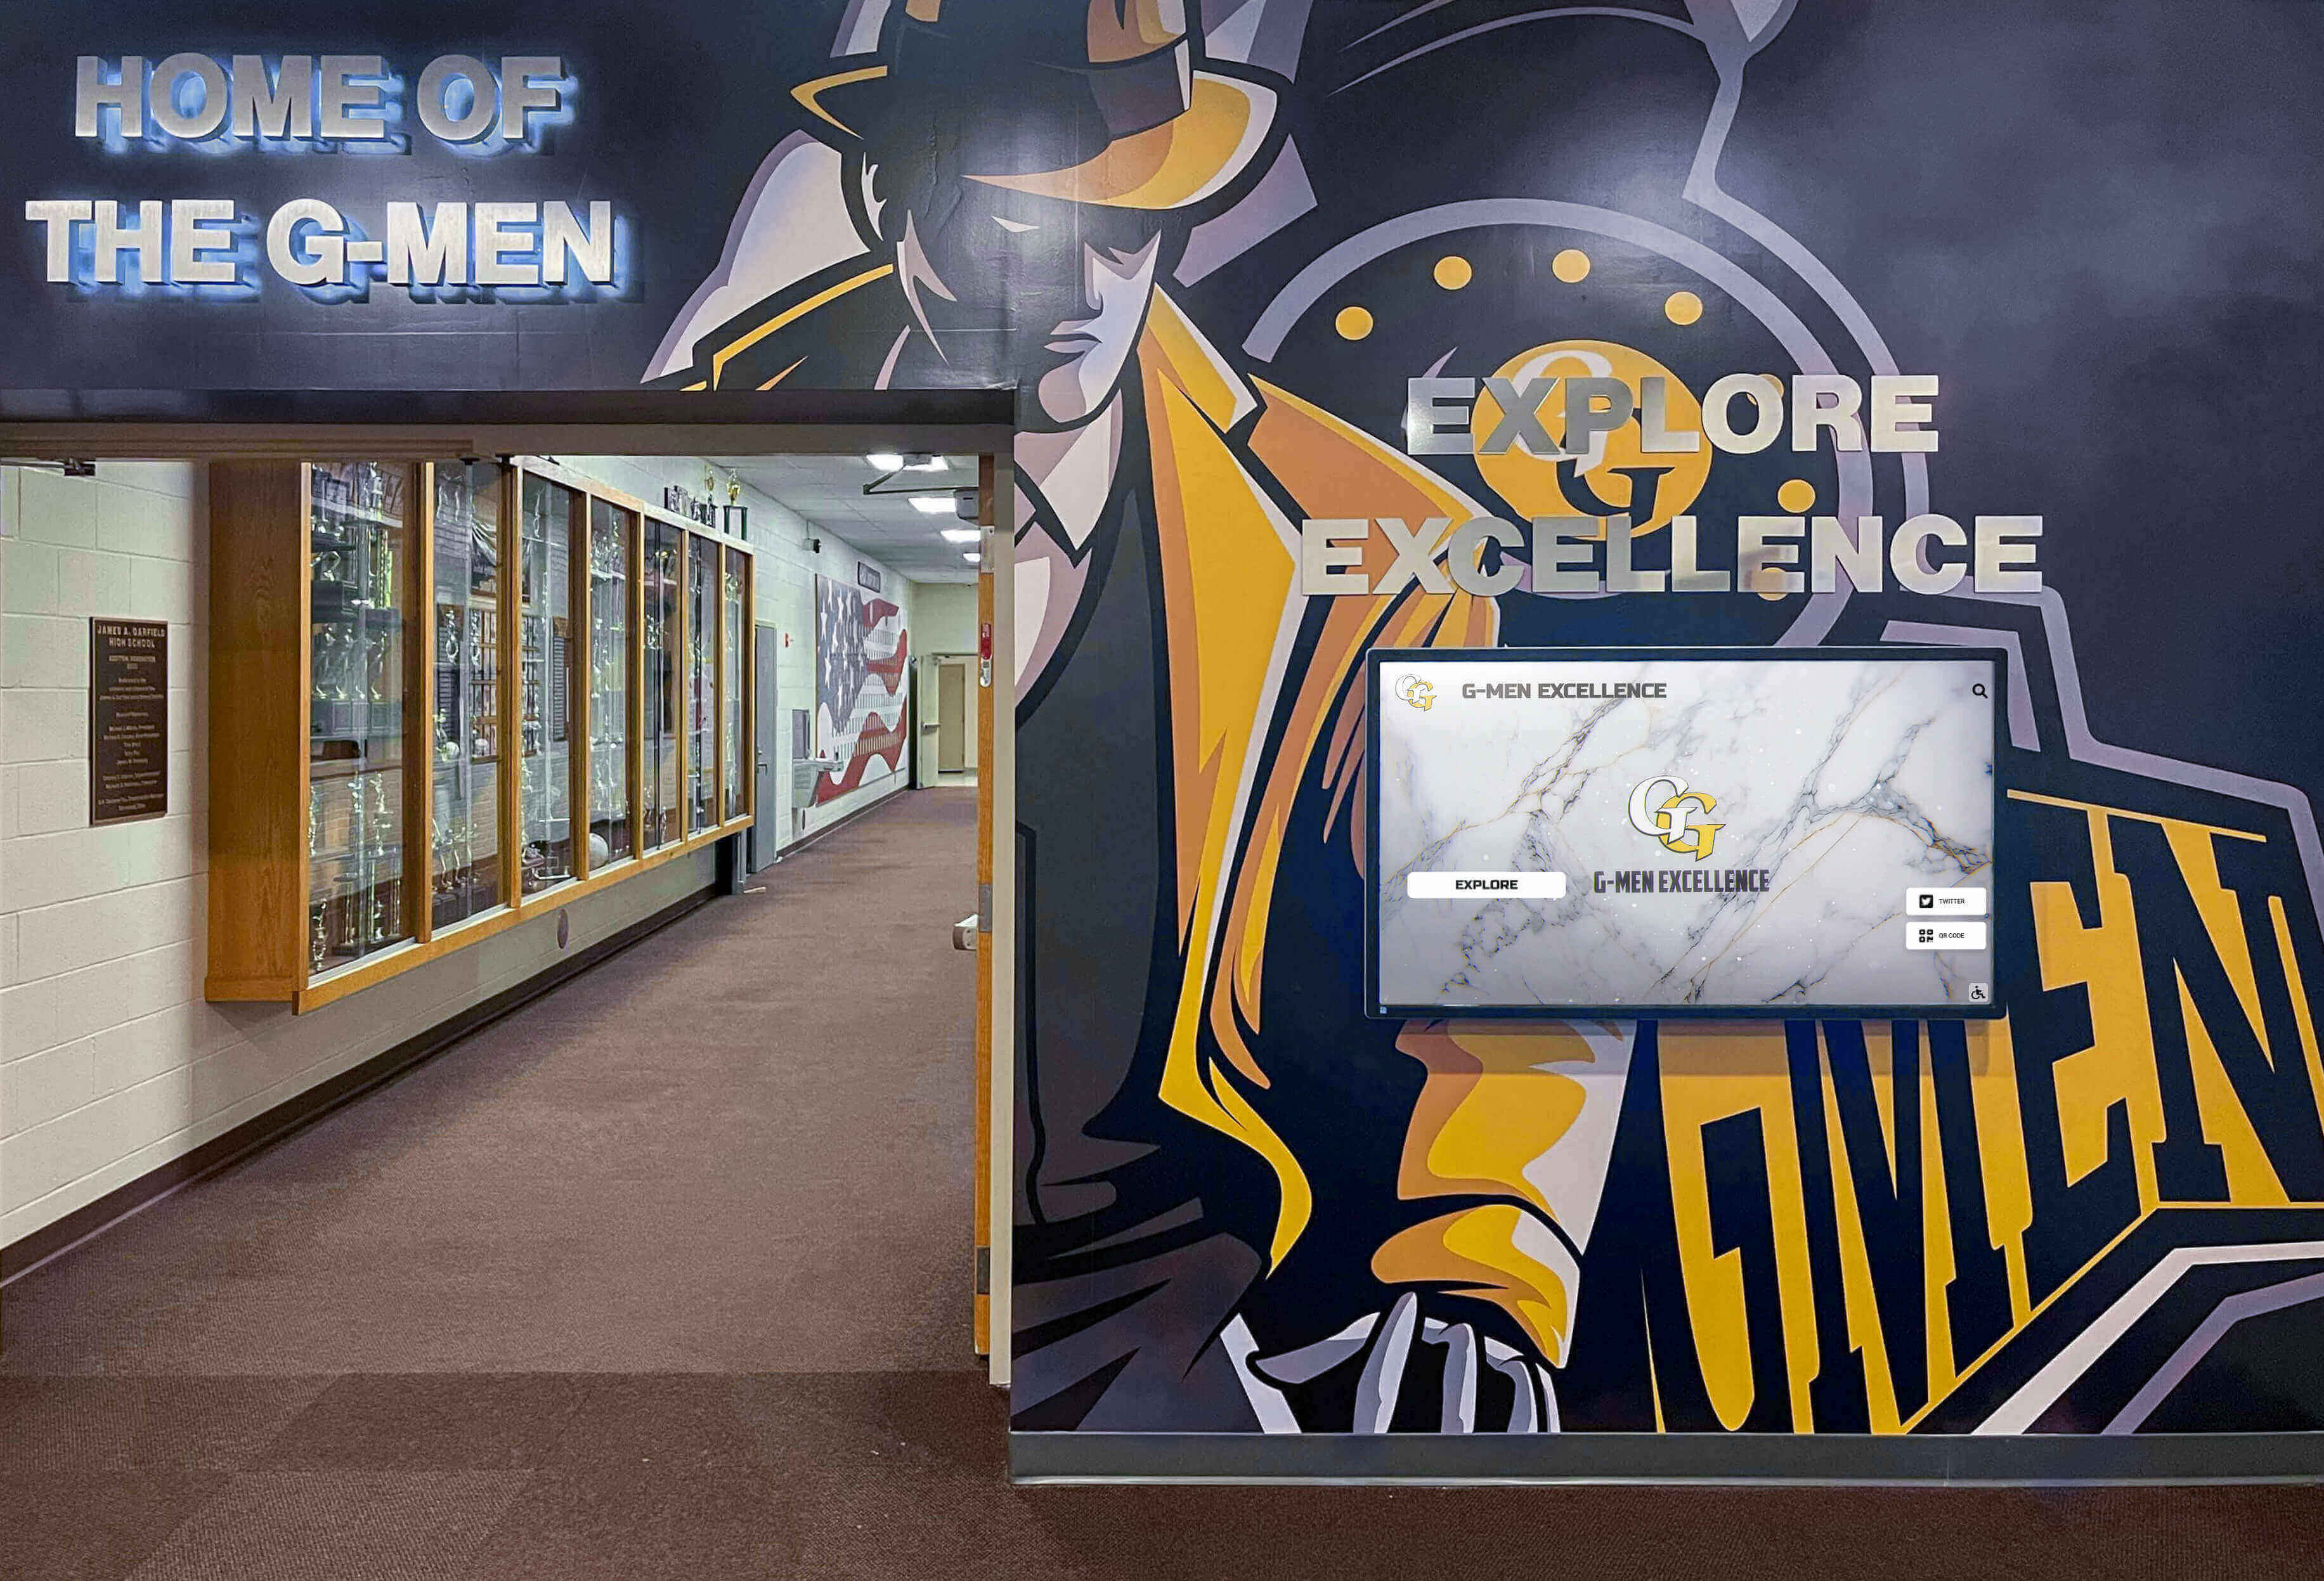
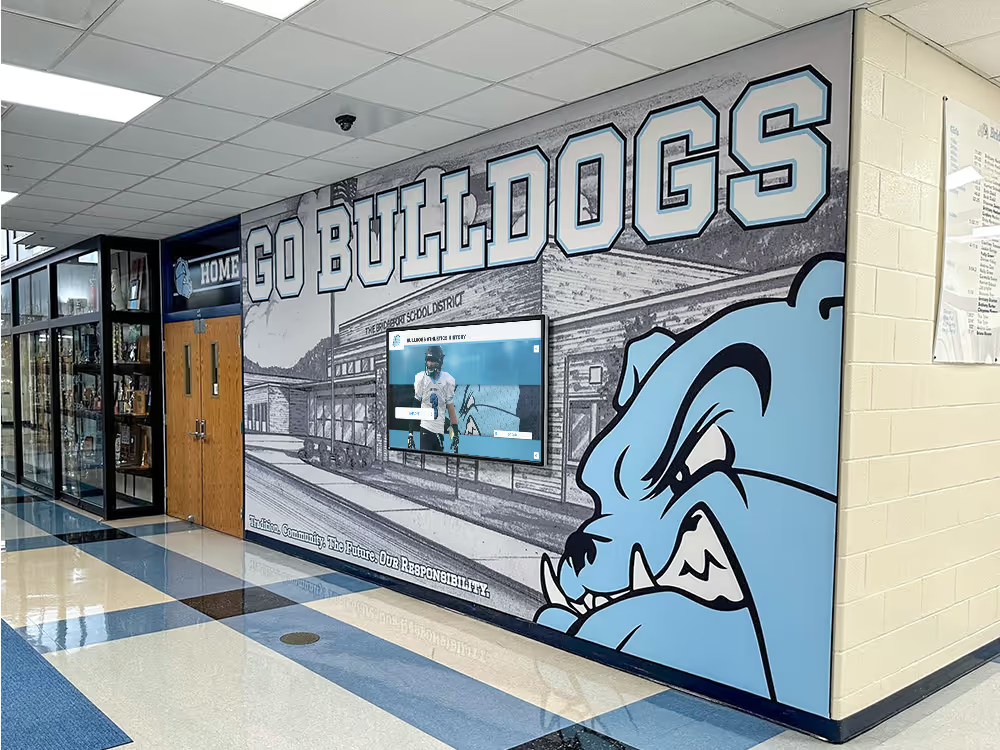
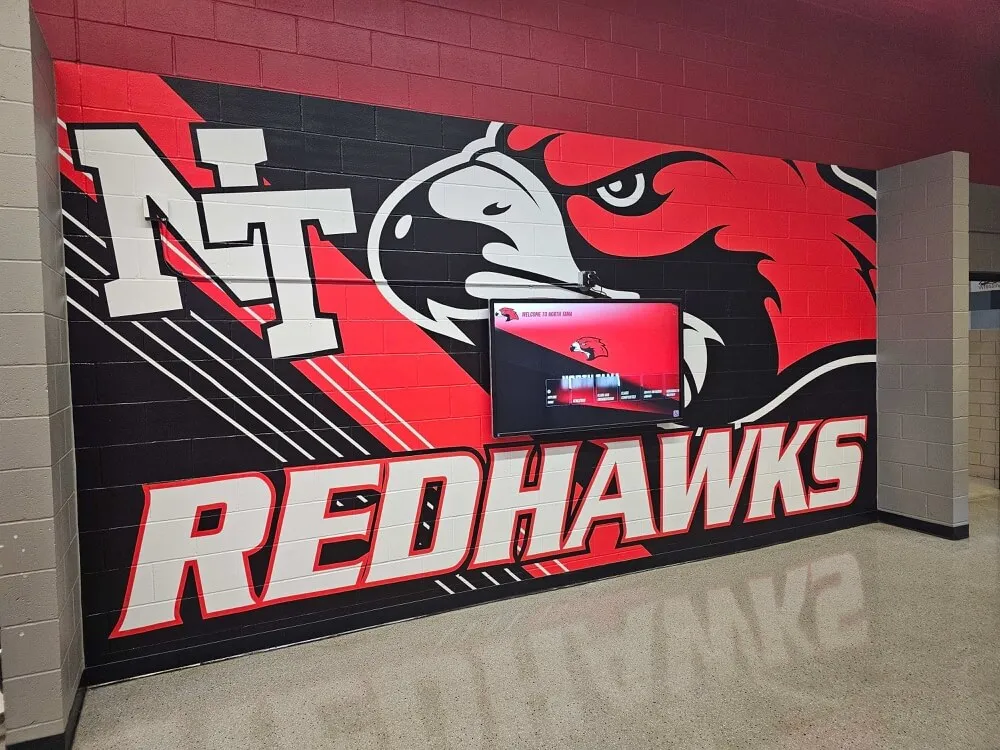
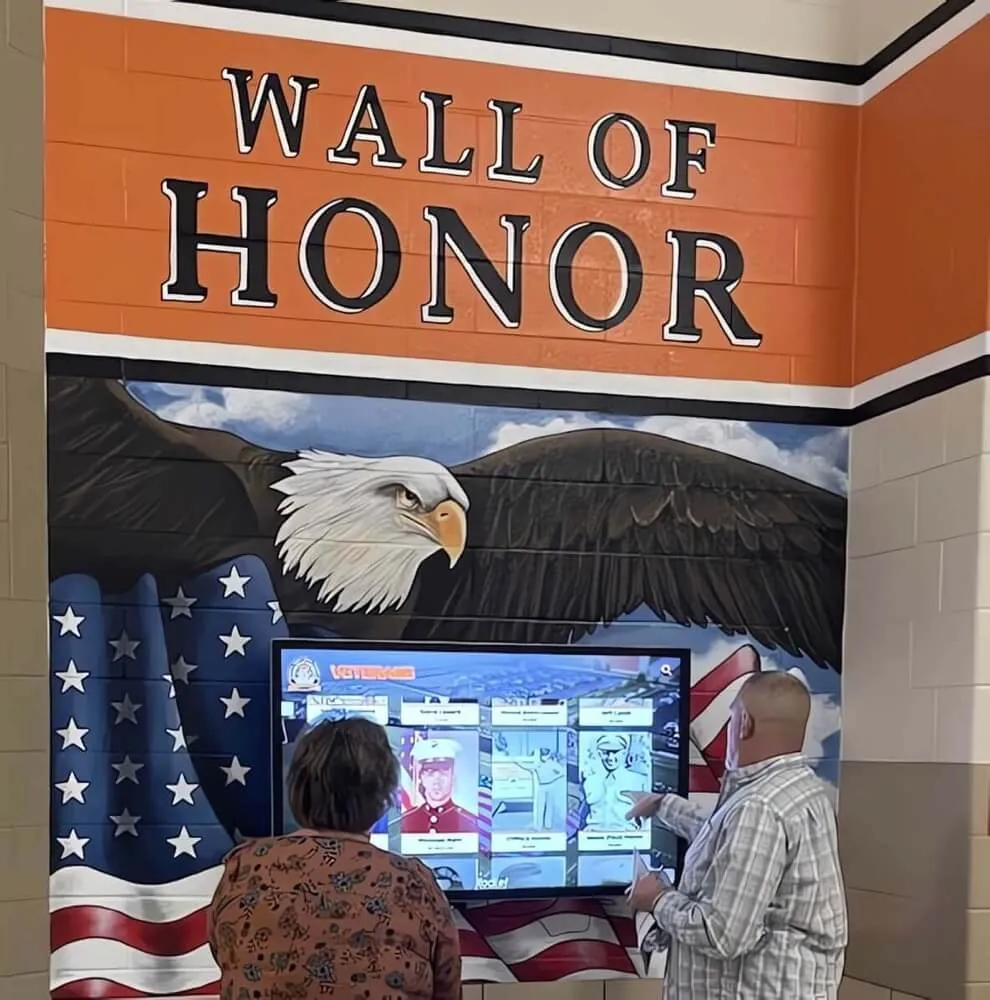
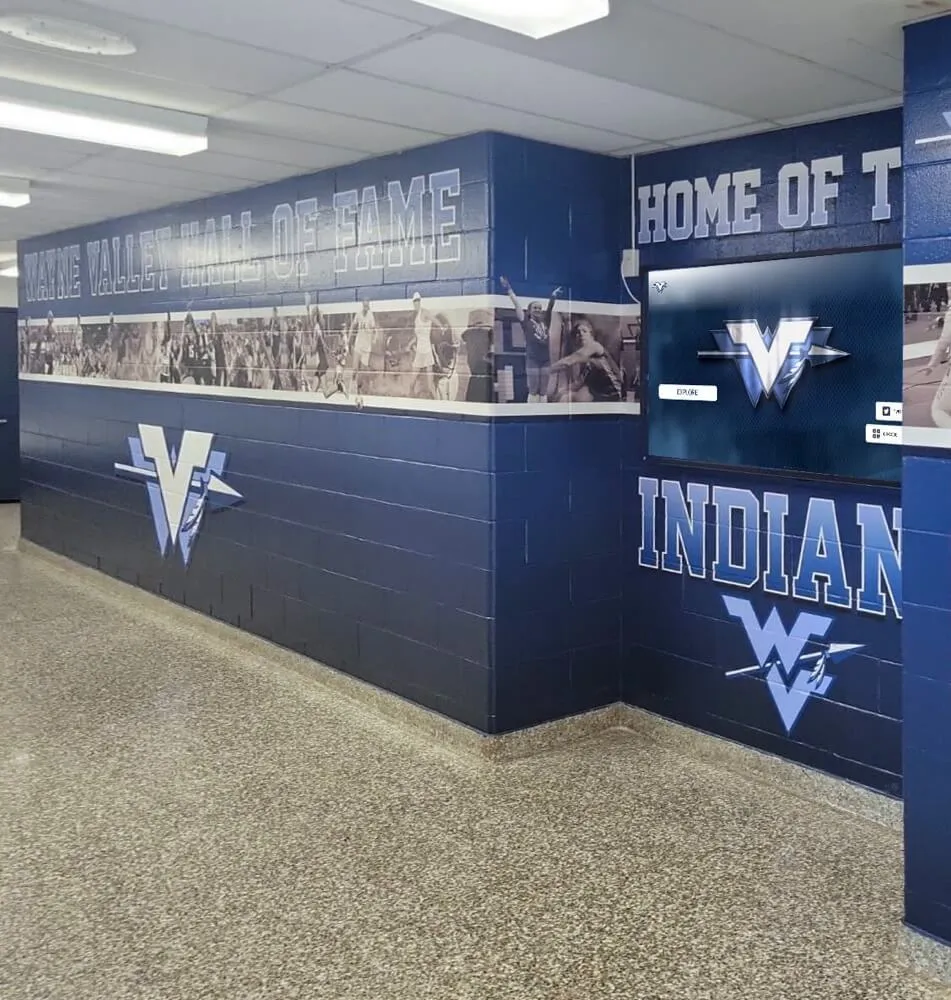
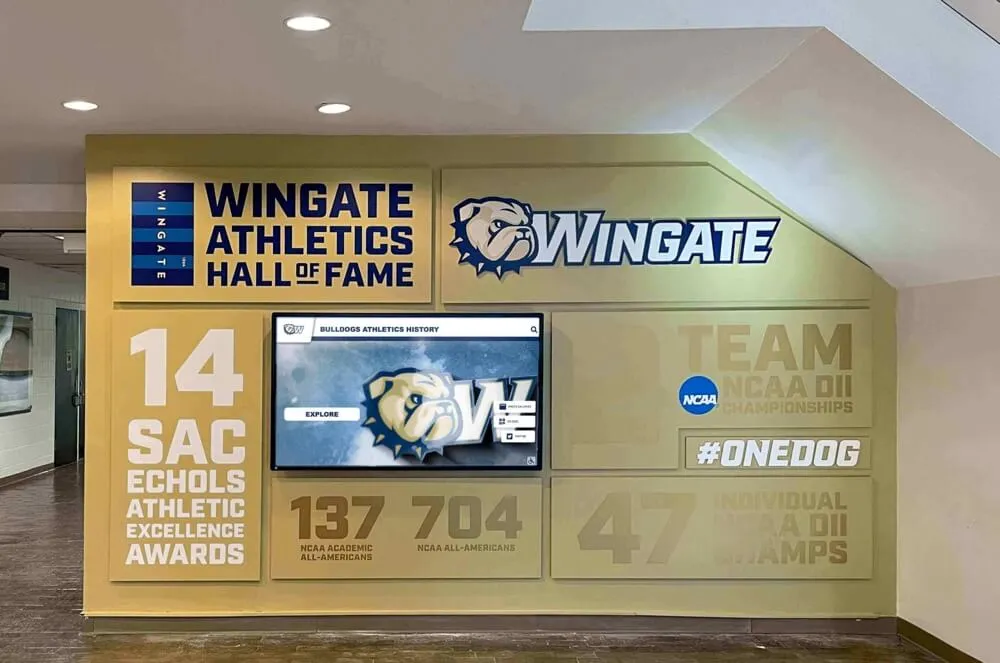
Hallway environments combining murals, physical trophy cases, and digital screens require LED lighting that is consistent in both color and flicker output across every fixture position
Flicker-Index Acceptance Thresholds for Trophy Case Lighting
The following thresholds draw from IES TM-30, ANSI/IES RP-16, and IEEE PAR 1789-2015 guidance for LED display-area lighting. Treat these as starting targets for school trophy case environments rather than absolute compliance standards; specific applications and building conditions may call for adjustment.
| Flicker Index | Risk Category | Verdict for Trophy Case Lighting |
|---|---|---|
| < 0.01 | Negligible | Pass — no action required; document and schedule next annual check |
| 0.01–0.04 | Low | Pass — log result; flag for priority check at six-month interval |
| 0.04–0.10 | Moderate | Escalate — inspect driver; schedule fixture replacement within 60 days |
| > 0.10 | High | Fail — replace before next scheduled photograph or public event |
| > 0.20 | Very High | Fail — remove from service immediately; visible strobing risk for sensitive visitors |
| Percent Flicker | Frequency Band | Risk Category | Verdict |
|---|---|---|---|
| < 8% | Any | Low | Pass |
| 8–30% | 50–120 Hz | Moderate | Escalate — driver quality concern; replace within 60 days |
| > 30% | 50–120 Hz | High | Fail — replace before next camera event |
| > 50% | Any | Very High | Fail — remove from service until replaced |
Practical notes on applying these thresholds:
- Record both Flicker Index and Percent Flicker for each fixture. A fixture may show acceptable Percent Flicker but elevated Flicker Index due to an asymmetric waveform shape — and vice versa. Both columns inform the pass/escalate decision.
- Camera-priority environments: at 120 Hz, fixtures with Flicker Index above 0.04 frequently produce visible banding in video shot at standard frame rates. Apply the stricter < 0.01 target for fixture positions directly above camera traffic areas.
- Photosensitive populations: trophy cases adjacent to commons areas used by students with photosensitive epilepsy or chronic migraine should target Flicker Index ≤ 0.01 regardless of camera traffic.
The School Trophy Case LED Flicker-Index Test: Step-by-Step Checklist
The following process requires a flicker meter capable of measuring Flicker Index and Percent Flicker at the relevant cycle frequency. Instruments from established photometric equipment manufacturers are appropriate for this measurement. Consumer-grade smartphone apps that use the camera rolling-shutter method can identify severe flicker (above 30% at visible frequencies) but cannot produce measurement-grade Flicker Index values and should not be used to generate pass/fail records for facilities documentation.
Pre-Test Checklist
- Confirm flicker meter is calibrated and within the manufacturer’s recommended recalibration interval
- Gather fixture documentation: brand, model, driver model, and installation date for each position
- Assign fixture position identifiers (F1, F2, F3, and so on) and photograph each numbered position for the audit record
- Note any fixtures replaced within the past 12 months — recent replacements from different procurement lots are common sources of variation
- Turn on all trophy case lighting at least 30 minutes before taking measurements — LED driver output and thermal behavior stabilize after warm-up, and cold readings may not reflect steady-state flicker performance
Measurement Checklist
- Position the flicker meter sensor facing the fixture at the distance specified by the instrument manufacturer (typically 15–30 cm from the light source, centered on the lamp)
- Record Flicker Index for each fixture position
- Record Percent Flicker for each fixture position
- Record the primary flicker frequency (Hz) for each fixture — the expected value is 100 Hz or 120 Hz depending on line frequency; unusual readings may indicate driver malfunction
- If your trophy case uses dimmer controls, repeat measurements at 50% and 25% dimming levels — flicker often worsens significantly at lower output levels
- Record correlated color temperature (CCT) if your instrument supports it, to cross-reference with any MacAdam ellipse audit conducted as a separate check
Evaluation Checklist
- Compare each fixture’s Flicker Index against the thresholds in the first table above
- Compare each fixture’s Percent Flicker against the second table for the measured frequency band
- Flag any fixture that falls into the Escalate or Fail category on either metric
- Note fixtures whose flicker frequency is inconsistent with others in the same case — mixed-frequency fixtures adjacent to each other increase stroboscopic risk for moving objects and cameras
- Identify whether any failing fixtures are positioned directly above interactive touchscreen panels, display plaques, or award photography backgrounds — these positions carry the highest camera-exposure risk and should be prioritized for replacement
Pass/Escalate/Fail Decision Checklist
- Pass — No Action Required: Flicker Index < 0.01 AND Percent Flicker < 8% at any frequency → Document result, record next scheduled test date, and file in facility maintenance log
- Pass — Monitor: Flicker Index 0.01–0.04 AND Percent Flicker < 8% → Log result; schedule a spot check in six months and flag for replacement at next regular fixture refresh cycle
- Escalate — 60-Day Replacement Window: Flicker Index 0.04–0.10 OR Percent Flicker 8–30% at 50–120 Hz → Inspect driver model; order replacement fixtures rated Flicker Index < 0.01; communicate timeline to athletic director and facilities coordinator
- Fail — Replace Before Next Event: Flicker Index > 0.10 OR Percent Flicker > 30% at any frequency → Order replacement immediately; schedule installation before any upcoming photograph session, banquet, or press event
- Fail — Remove from Service: Flicker Index > 0.20 OR Percent Flicker > 50% → Operate case without this fixture until replacement arrives; visible strobing and photosensitive risk warrant immediate removal
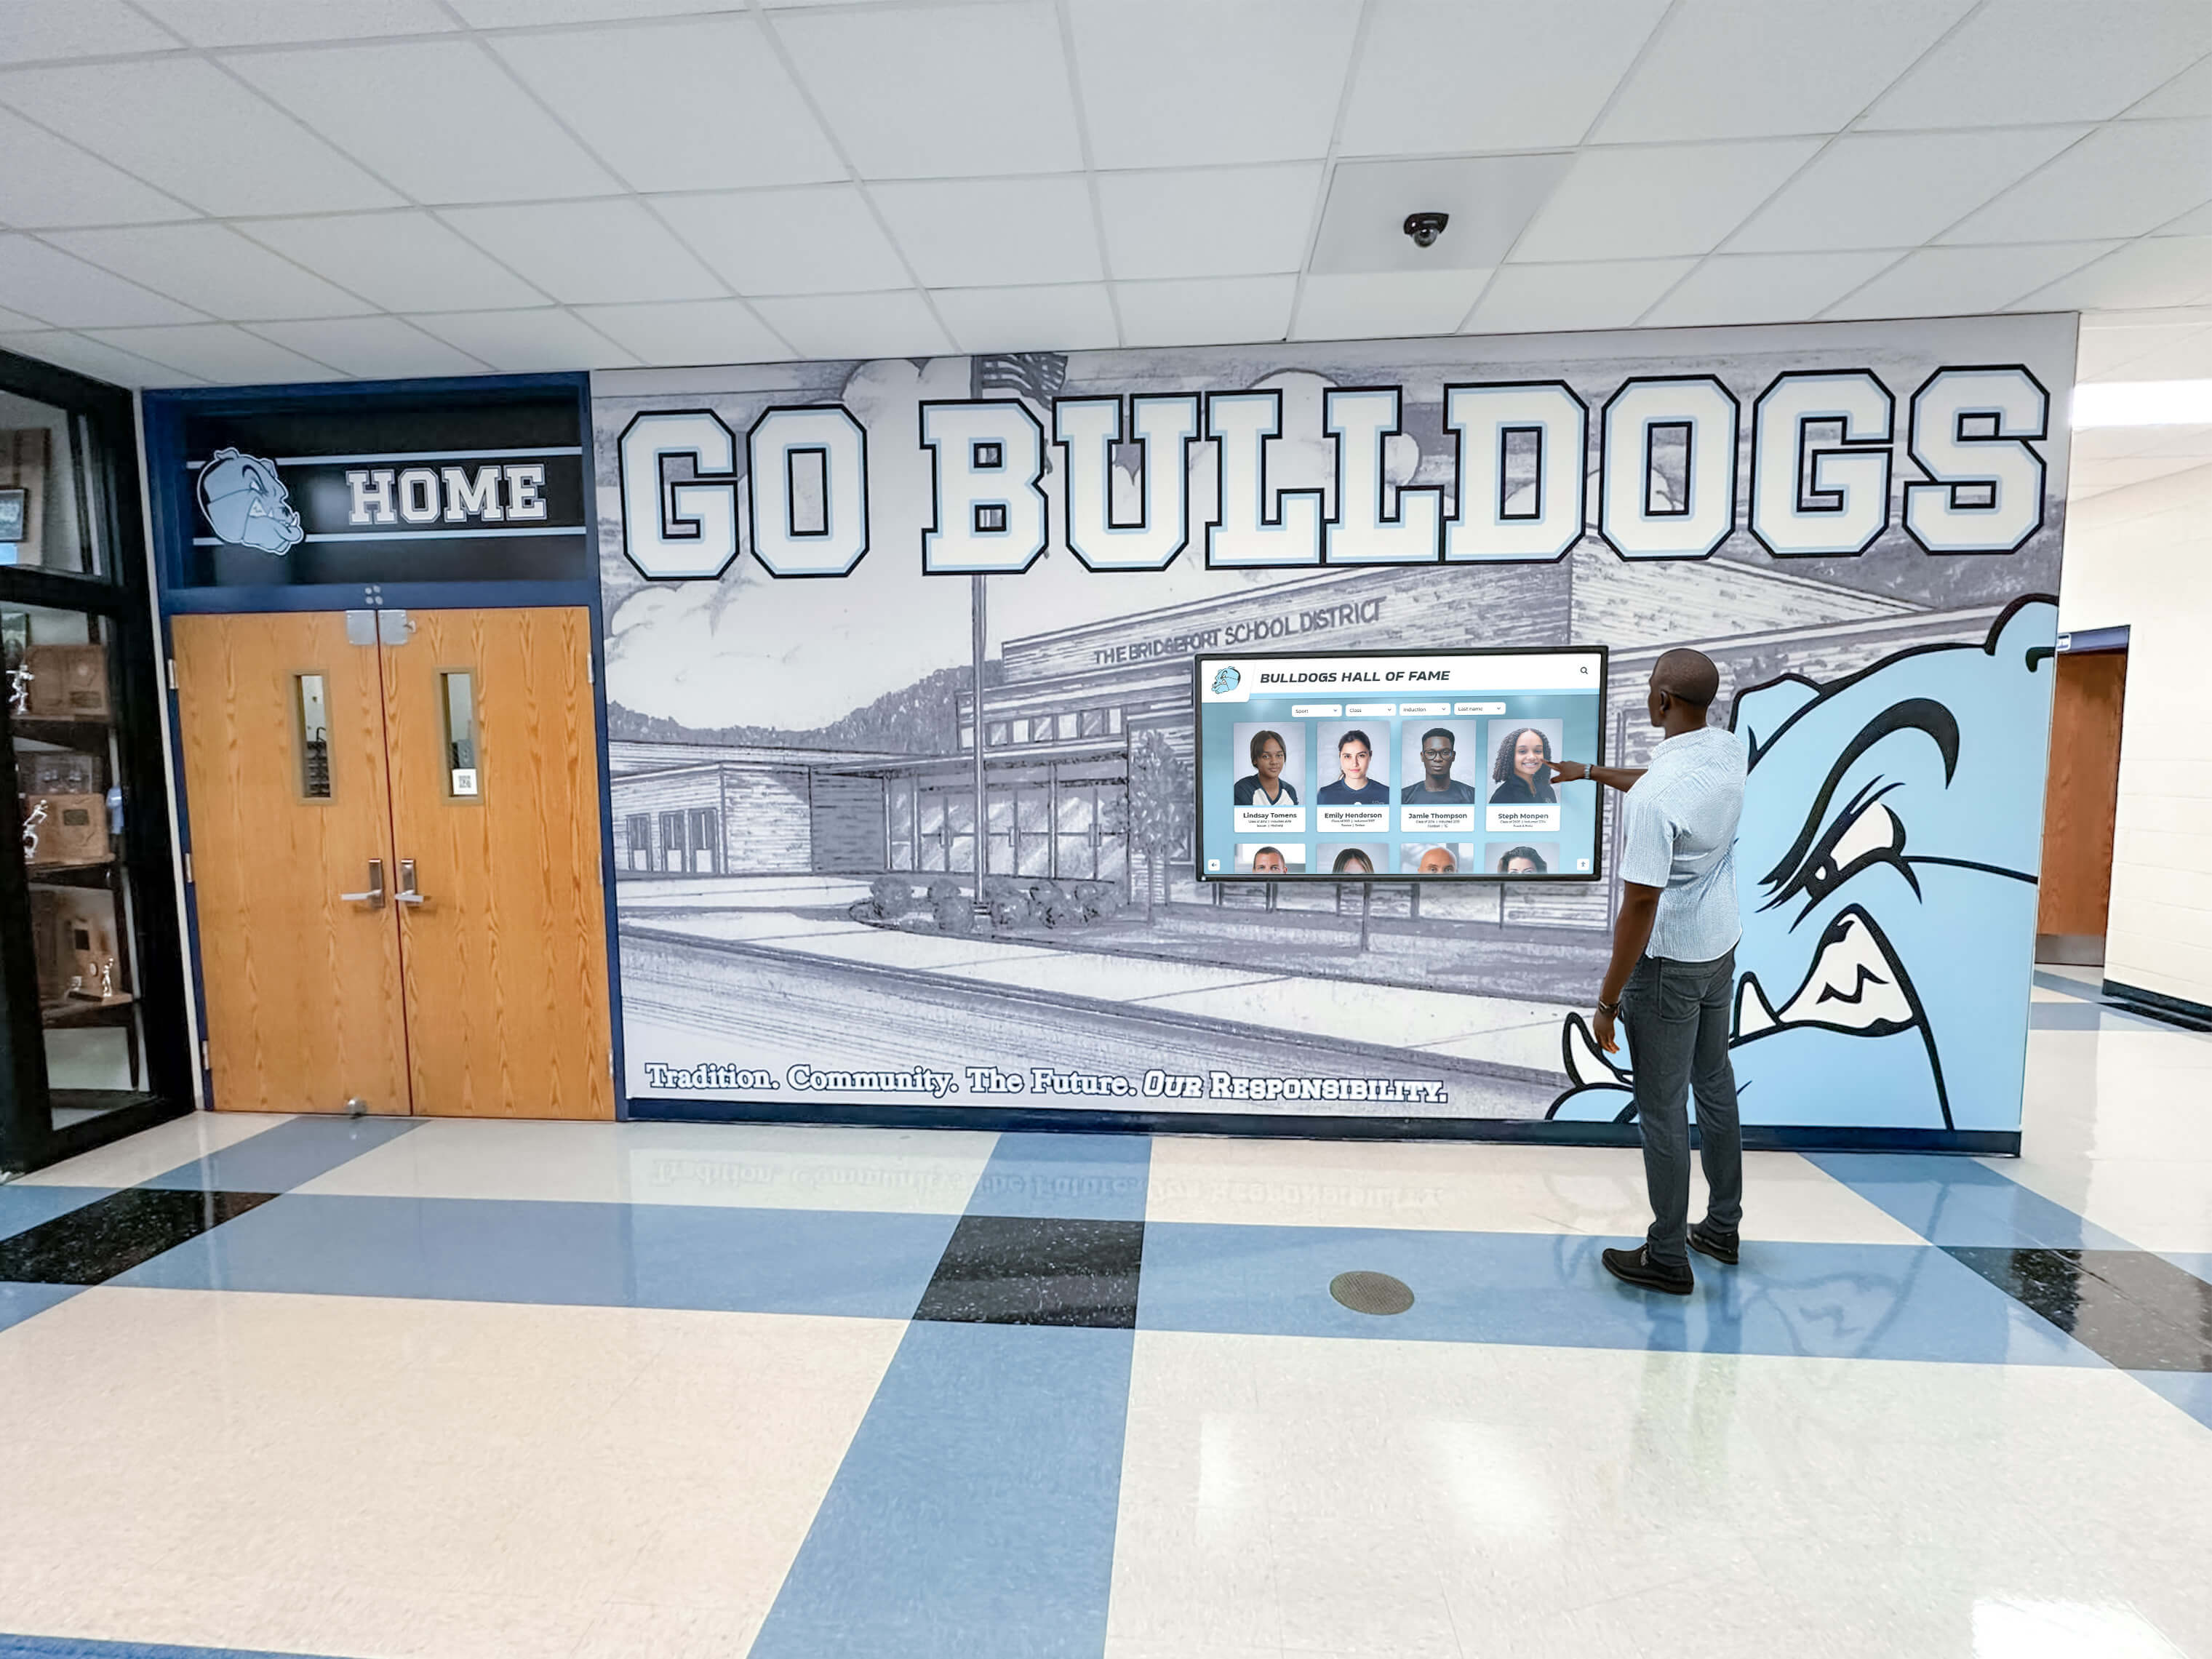
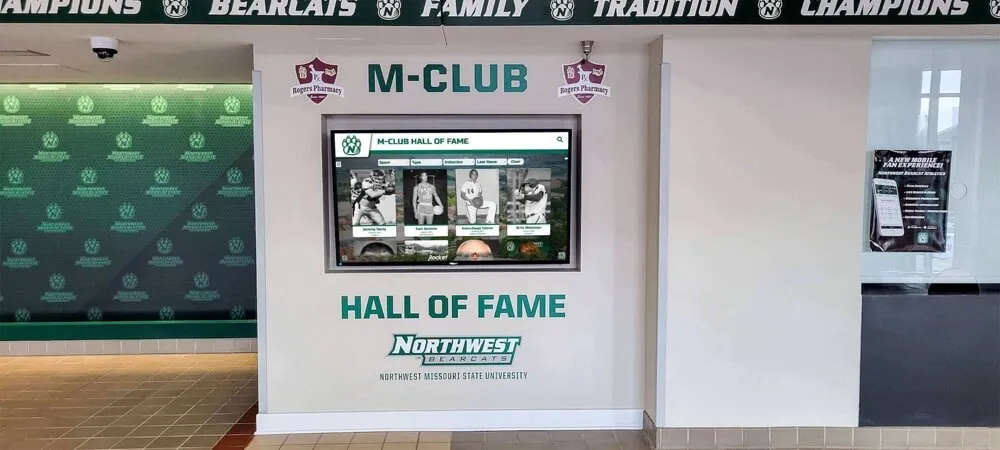
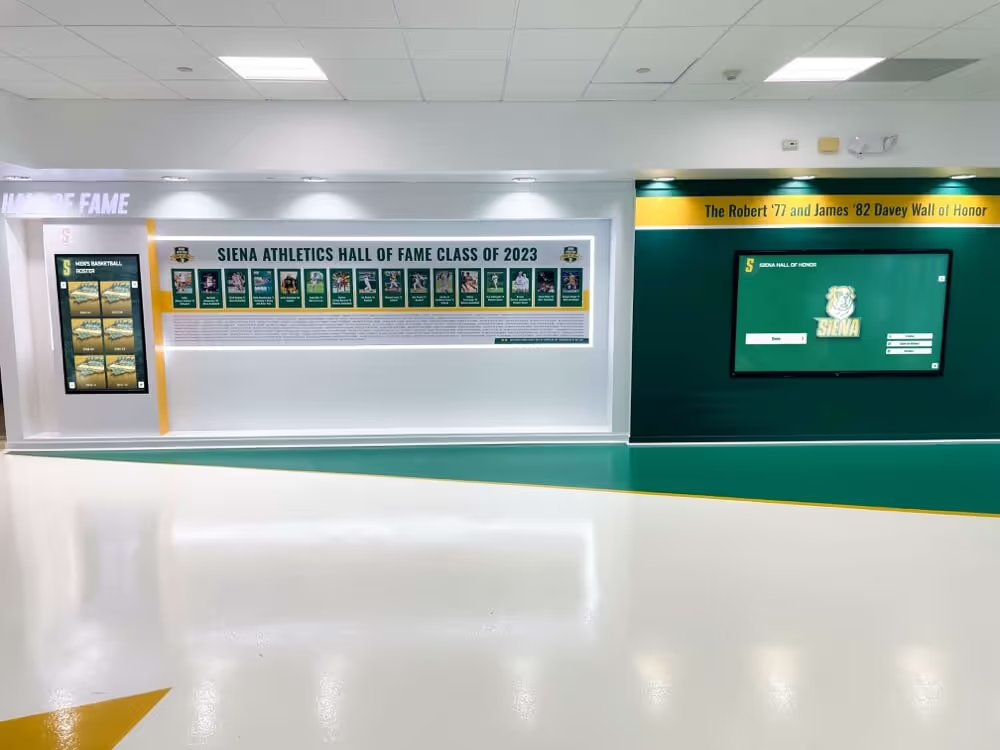
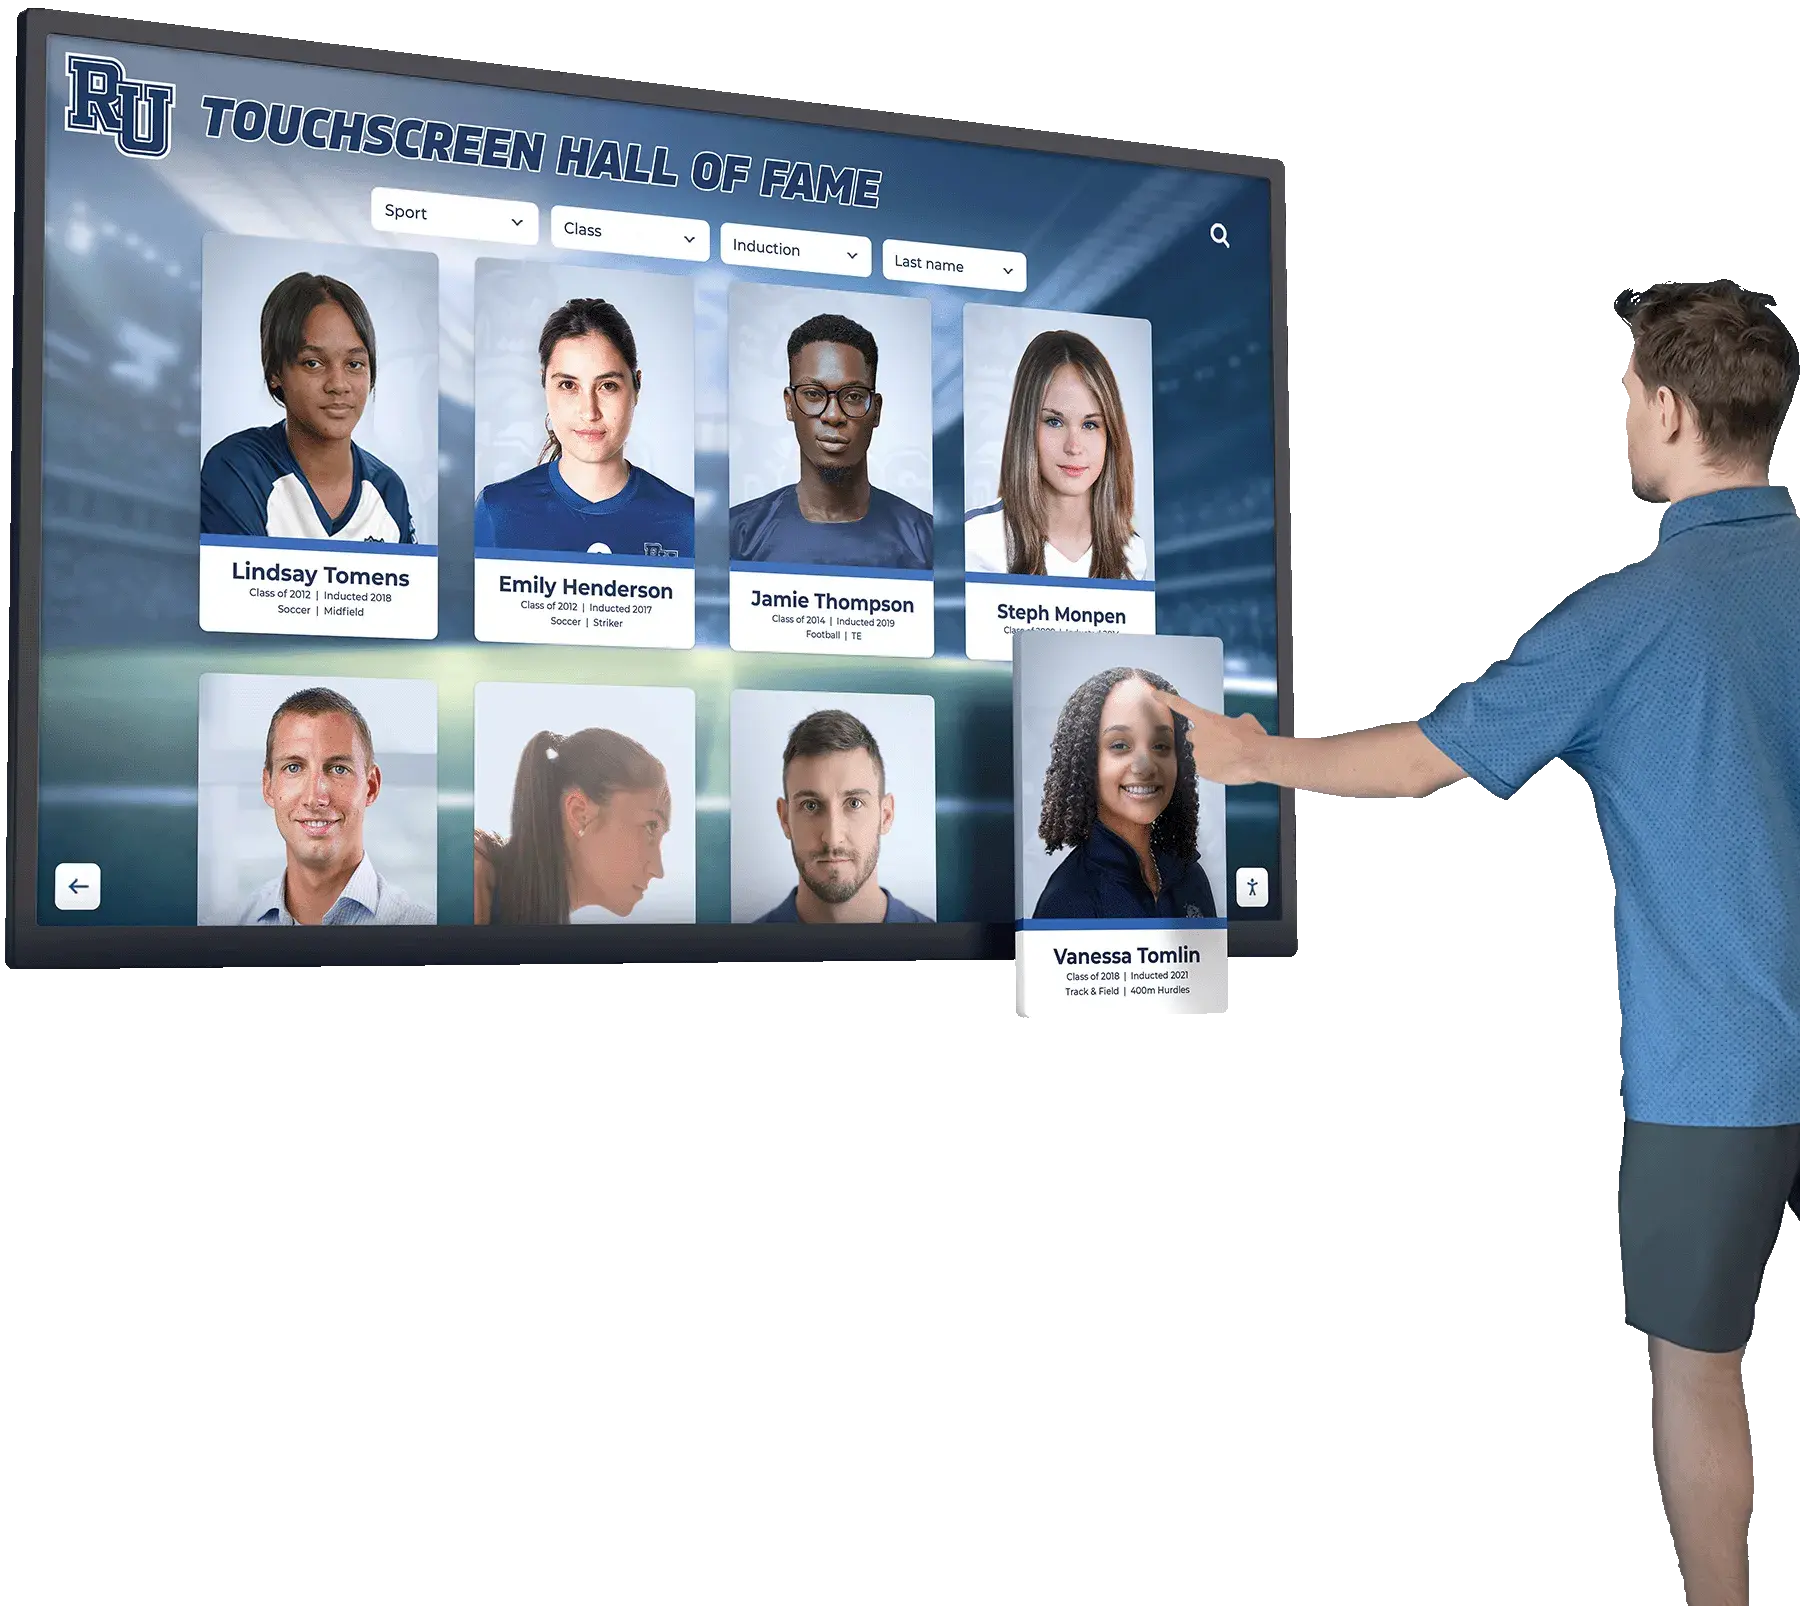
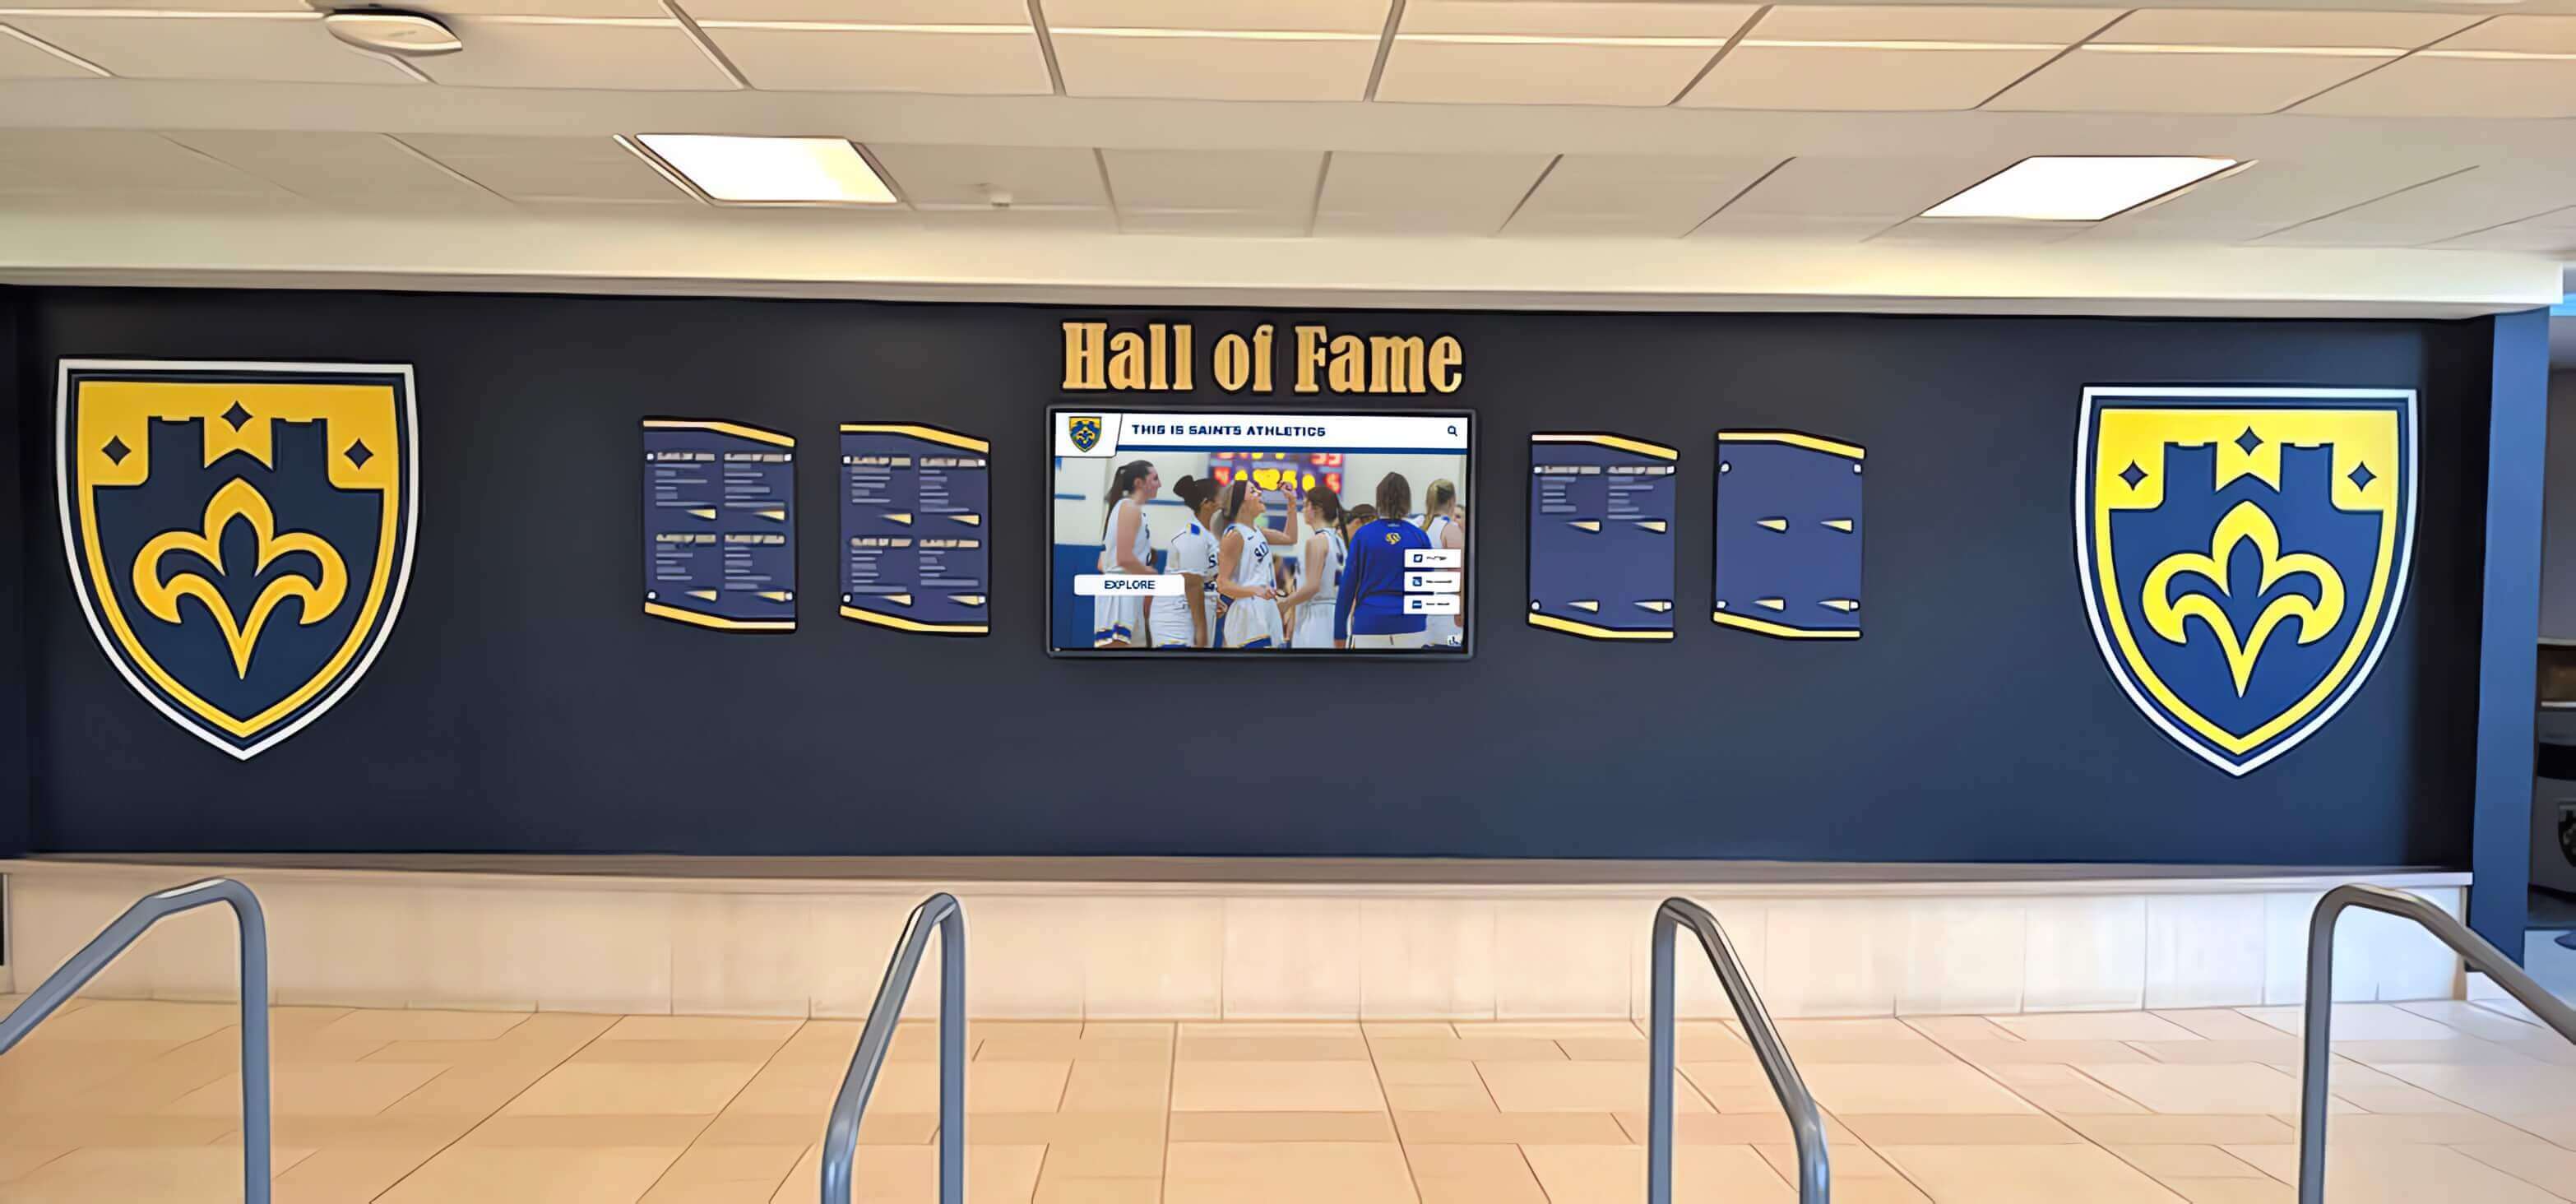
Interactive digital displays in trophy case corridors attract extended visitor dwell time — the same LED fixtures lighting physical cases illuminate the surrounding environment, making flicker index relevant to every element of the display space
See Flicker-Free Digital Award Displays in Action
If your trophy case lighting audit keeps surfacing the same driver problems, a digital recognition platform eliminates the maintenance cycle entirely. See how schools create vivid, consistent award displays with factory-calibrated screens that hold color and stability across their full rated lifespan.
Book a DemoWhat Causes Elevated Flicker Index in Trophy Case Fixtures
Understanding the root causes of high Flicker Index readings helps facilities teams make better procurement decisions and anticipate which fixtures are likely to degrade fastest, rather than discovering the problem only during the annual audit.
Supplementary Measurements: Completing the Flicker Audit
A Flicker Index measurement provides the primary metric for the pass/escalate decision. Paired with two additional measurements, it gives a complete characterization of trophy case lighting quality that informs both immediate replacement decisions and long-term procurement standards.
Stroboscopic Visibility Level (SVM): A perceptual metric standardized in CIE TN 006:2016 that predicts whether moving objects — a visitor’s hand gesturing at the case, a camera pan across the trophy display, a rotating award base — will appear to strobe. SVM values below 0.8 are not noticeable to most observers; values above 1.6 are clearly perceptible. Advanced flicker meters report SVM directly. For trophy cases that include mechanical rotating displays or motorized pedestals, SVM is as diagnostically important as Flicker Index.
Color Temperature Stability Under Flicker Conditions: Fixtures with high Flicker Index occasionally show correlated color temperature variation within the waveform cycle — appearing subtly warmer at the output peak and cooler during the trough. A standard colorimeter time-averages across many cycles and misses this variation, but it can contribute to the perception that trophy finishes look unstable or that gold and silver hardware lacks the visual depth it showed in the procurement catalog. If a MacAdam ellipse audit returns unexpected color variance that does not correlate with fixture age or procurement lot, check Flicker Index before ordering replacement fixtures — the cause may be driver-related rather than chromaticity-related.
Illuminance Distribution Cross-Check: Measure lux at the trophy surface under each fixture immediately following the flicker measurement, using the same fixture map. Illuminance variance greater than 3:1 between the brightest and dimmest positions is a display-quality concern independent of flicker index, and the combination of uneven illuminance and elevated flicker index in the same fixture position identifies the highest-priority replacements in the case.
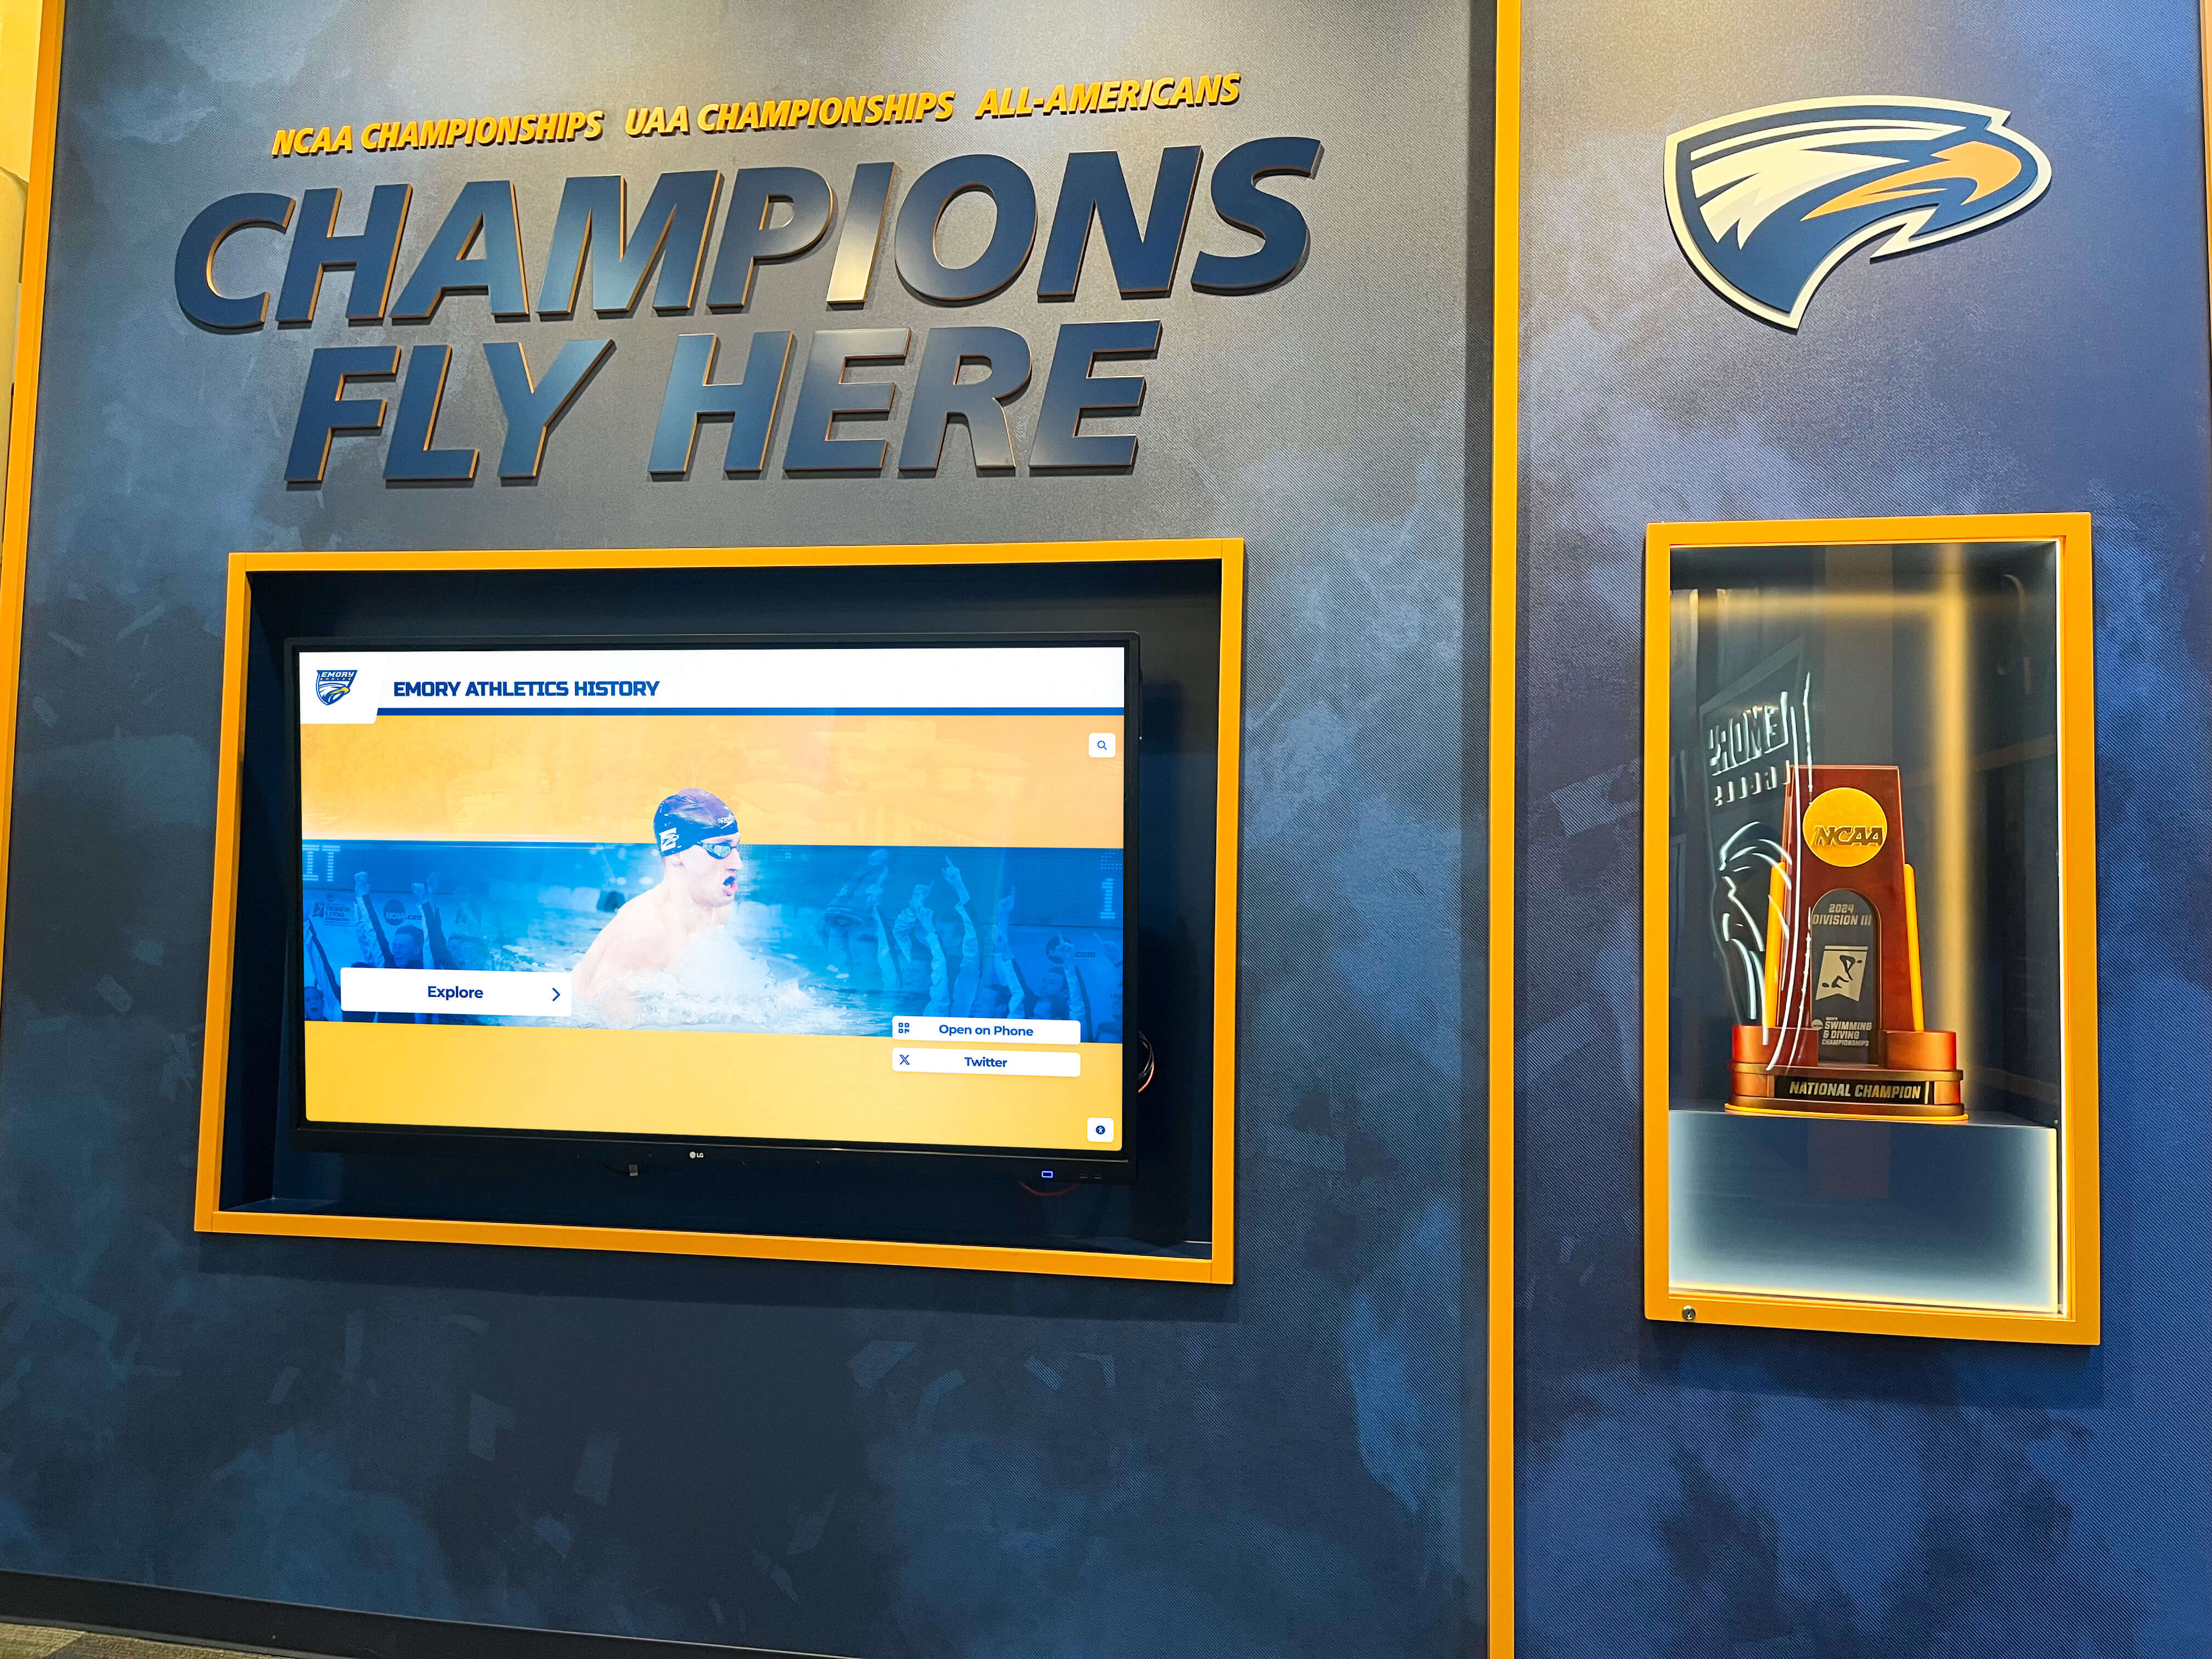
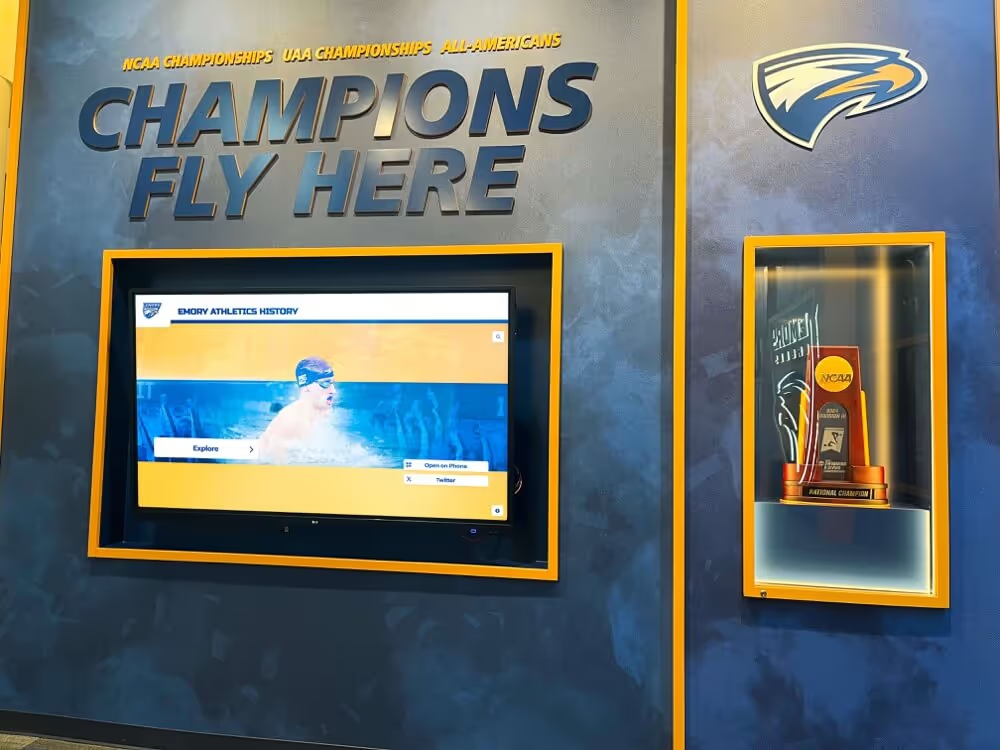
Championship trophy displays require lighting that is stable in output, consistent across fixture positions, and camera-friendly — flicker index is the measurement that confirms all three
Documenting and Scheduling the Flicker Audit Program
A single flicker index test is useful. An annual documented program is what builds institutional continuity across staff transitions and gives future administrators a maintenance history to build on rather than a blank slate to rediscover.
| Audit Interval | Scope |
|---|---|
| Annual | Full Flicker Index and Percent Flicker measurement for all fixture positions; update fixture map; record next scheduled date |
| After any fixture replacement | Spot-check replacement fixture against documented reference values before closing the case |
| Before major events | Visual inspection and lux check; trigger full flicker measurement if any complaint or camera report has been received since last audit |
| When complaints are received | Immediate full measurement; prioritize positions nearest the reported location of the complaint |
| Every 3–5 years | Full driver replacement review; re-evaluate fixture specifications against current IES recommendations and budget for systematic upgrade if significant fleet drift is documented |
Recommended documentation to retain after each audit:
- Fixture map with numbered positions and photographs of each
- Flicker Index and Percent Flicker values by fixture position and measurement date
- Flicker frequency (Hz) for each position
- Driver brand, model, and driver age estimate
- Replacement procurement records specifying Flicker Index ≤ 0.01 at rated output
- Next scheduled audit date and assigned responsible party
- Any complaints or camera reports received since the previous audit
Connecting Flicker Audits to Broader Recognition Program Standards
A flicker index test in isolation produces useful data. Embedded in a broader lighting quality program, it contributes to the long-term integrity of the recognition environment that represents your institution’s athletic and academic history.
Schools developing recognition programs that span trophy cases, academic award displays, and community recognition walls apply the same lighting quality principles across contexts. The standards that govern how a program presents retirement plaque wording and award presentation materials to recipients and families are reflected in every element of the display environment, including the stability and color accuracy of the fixtures illuminating those awards.
Athletic programs building comprehensive recognition environments — integrating physical trophy cases, wall-mounted banners, and digital display panels — benefit from audit programs that address all fixture types in a coordinated schedule. K-12 school athletic program signage and display design frequently combines physical and digital recognition elements in the same corridor space, and the flicker index test applies equally to the LED strips in the trophy case and the ambient fixtures illuminating the surrounding hall. Donor recognition wall design and display quality involves the same lighting quality requirements as athletic trophy cases — recognition programs that take one seriously typically extend consistent standards to all display environments.
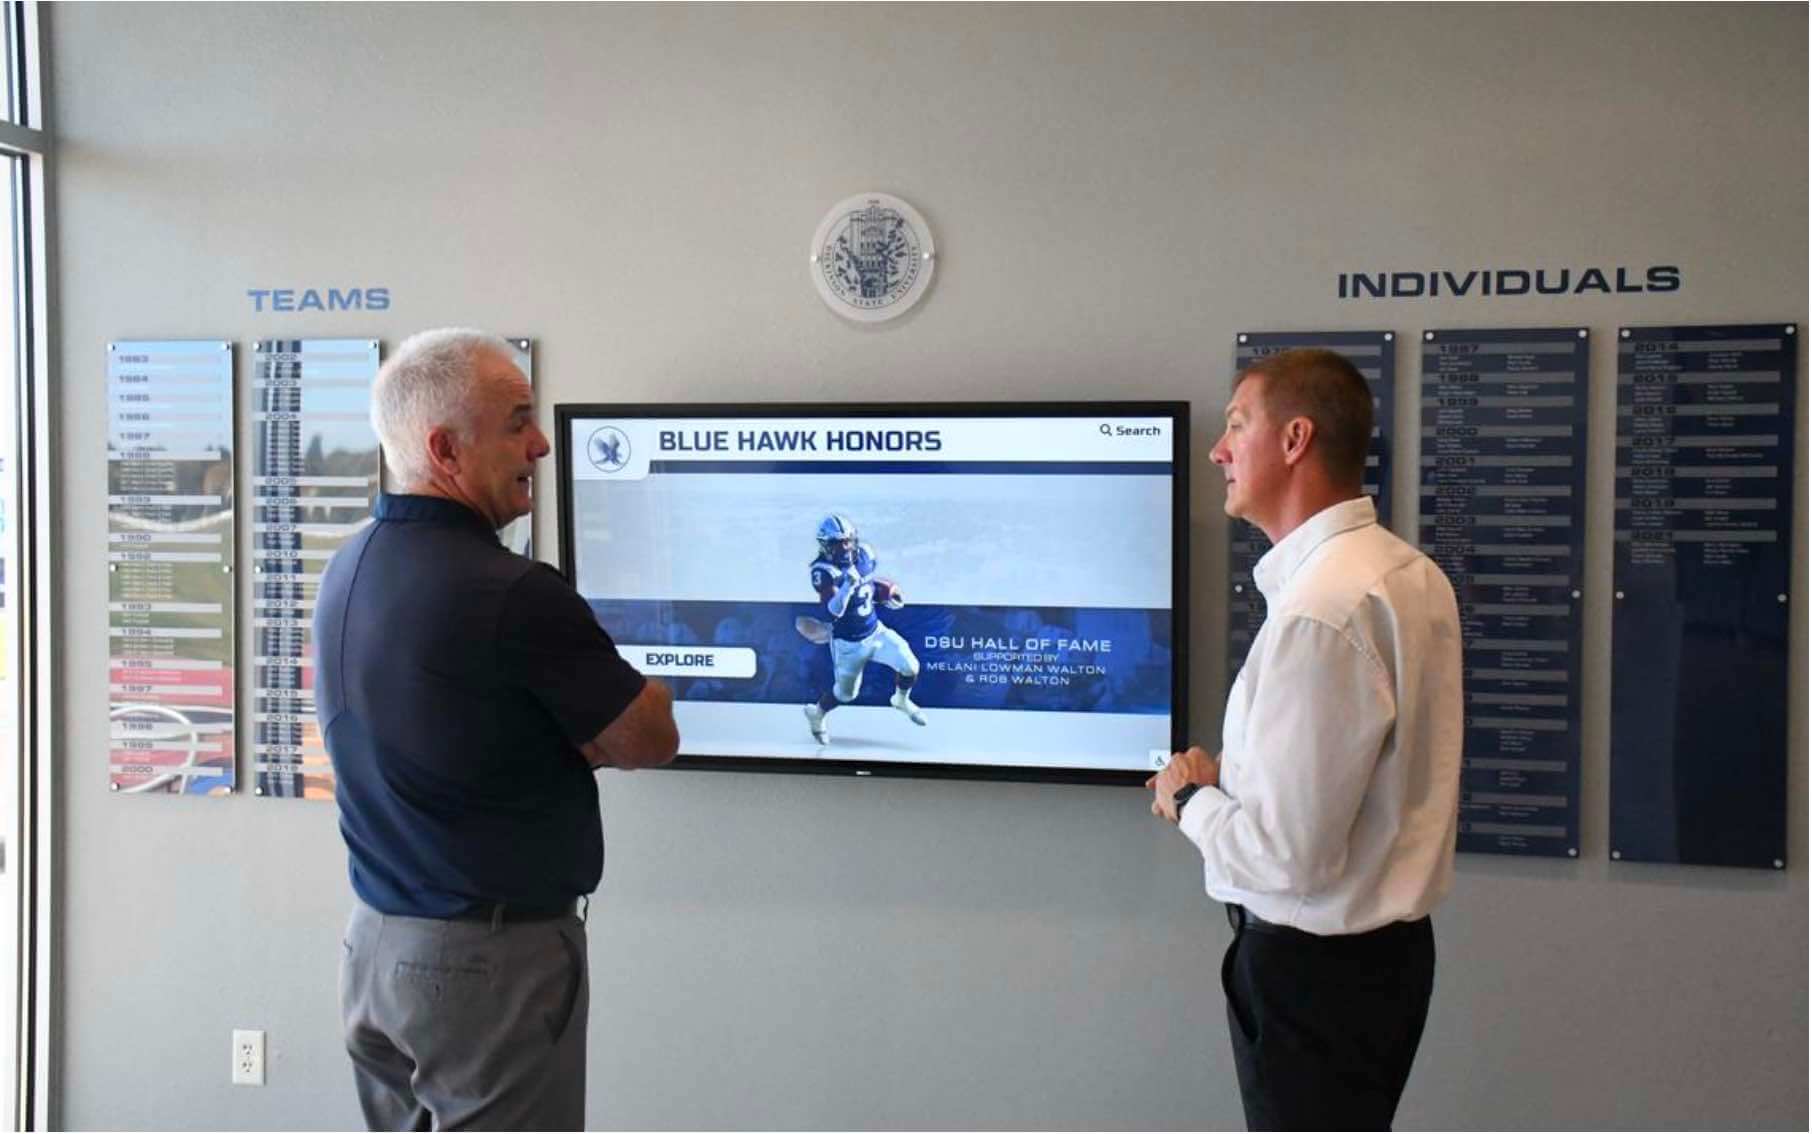
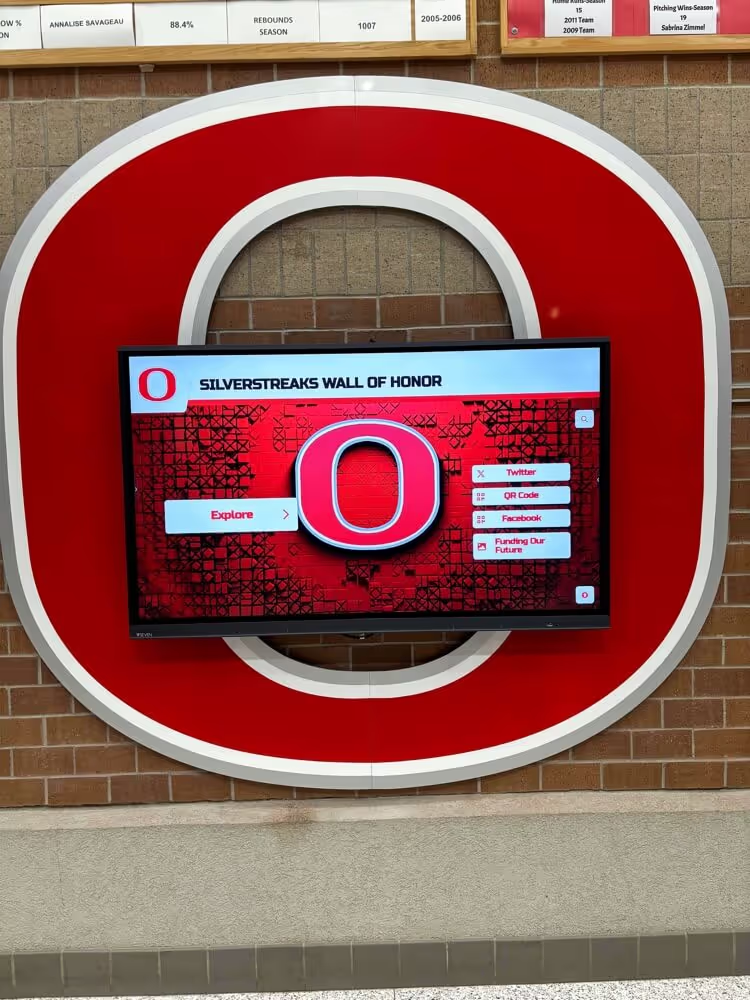
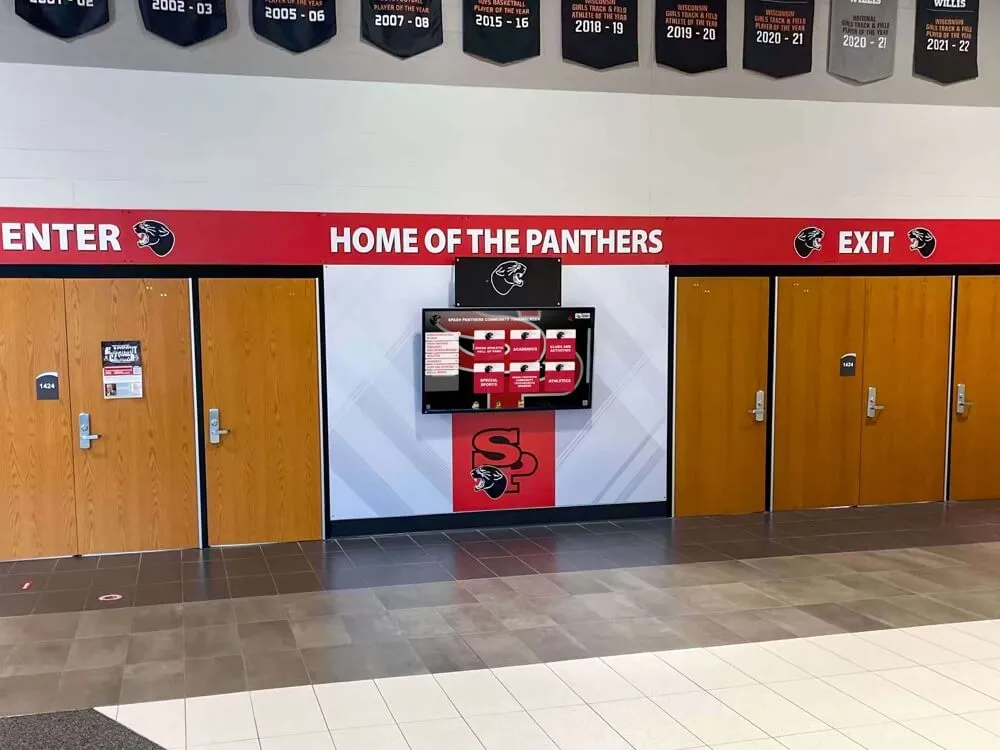
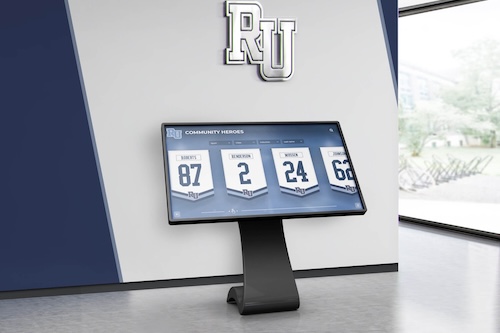
Administrative staff engaged with recognition displays benefit from documented lighting audit programs — institutional knowledge about fixture performance rarely survives staff transitions without written records
When Flicker Audits Point Toward Digital Recognition
Physical LED trophy case fixtures require ongoing flicker index monitoring because they rely on commodity drivers subject to manufacturing variation, capacitor aging, and procurement inconsistency. Commercial-grade digital recognition displays operate differently: internal backlighting systems engineered to display-industry standards for stable light output produce flicker performance well below the thresholds that trigger intervention in physical fixture audits. The search relevance testing and quality assurance practices that schools apply to their recognition content systems have direct parallels in hardware quality standards — platforms built to commercial-grade specifications have fewer failure modes than consumer-grade alternatives in both software and display hardware.
For schools whose flicker index audits repeatedly surface the same fixture positions — or whose physical trophy case infrastructure has accumulated years of mixed procurement lots with undocumented driver specifications — a digital recognition platform offers a maintenance structure that eliminates the lighting audit cycle for the recognition display itself. Schools managing multi-sport recognition displays including wrestling championships, team records, and season award archives find that digital transitions resolve not only lighting consistency challenges but also the space constraints that limit what a physical trophy case can display at any given time.
The parallel to other visual quality programs is instructive: just as yearbook senior page design and visual presentation standards depend on consistent quality across every page layout, trophy case display quality depends on consistent photometric standards across every fixture position. The flicker index test is the instrument for enforcing that standard in a physical display environment.
Frequently Asked Questions
Conclusion: Objective Measurement, Confident Decisions
A school trophy case LED flicker-index test replaces guesswork with documented numbers. The fixtures that cause camera banding during the athletic banquet, that generate complaints from staff working near the display, or that make championship trophies look less stable on camera than they should — these problems are correctable when you know which fixture positions are failing and by how much.
The process is structured and repeatable: document fixture positions, allow adequate warm-up time, measure Flicker Index and Percent Flicker at each position, compare against the acceptance thresholds, and apply the pass/escalate/fail checklist to determine what action each position requires. Ordering replacement fixtures with published Flicker Index ≤ 0.01 from the same driver family closes the loop and prevents the procurement variation that is the single most common root cause of trophy case lighting inconsistency.
Running this measurement annually and after every fixture replacement builds a documented maintenance history that supports both facilities planning and recognition program credibility — ensuring that the LED lighting in your school’s trophy case is as consistently professional as the awards it illuminates.
See How Digital Recognition Handles Lighting Consistency Automatically
If your trophy case lighting audit keeps surfacing the same driver problems year after year, a digital recognition platform may be the more durable solution. See how schools create vivid, consistent award displays with factory-calibrated screens — no annual flicker audit required, and unlimited recognition capacity beyond what any physical case can hold.
Schedule Your Demo